___________________________________________________________________________________________________________________
Visión de futuro
REVISTA CIENTIFICA
ISSN 1668 - 8708 VERSION EN LINEA
URL DE LA REVISTA: http://visiondefuturo.fce.unam.edu.ar/index.php/visiondefuturo/index
E-mail: revistacientifica@fce.unam.edu.ar
_____________________________________________________________________________________________________________
AÑO 17, VOLUMEN 24 N° 1, ENERO - JUNIO 2020
URL DEL DOCUMENTO: http://visiondefuturo.fce.unam.edu.ar/index.php/visiondefuturo/issue/view/17
Los trabajos publicados en esta revista están bajo la licencia Creative Commons Atribución-NoComercial 2.5 Argentina
POVERTY REDUCTION IN MEXICO? CASE STUDY FOR QUINTANA ROO 2010-2016
Miguel Angel Barrera Rojas
_______________________________________________________________________________________________________________________
Poverty reduction in Mexico? Case study for Quintana Roo 2010-2016
(*) Miguel Angel Barrera Rojas
(*) Division of Political Science and Humanities
University of Quintana Roo
Chetumal, Quintana Roo, México
Miguel.barrera@uqroo.edu.mx
Reception Date: 09/26/2019 – Approval Date: 12/16/2019
ABSTRACT
This paper evaluates the status of poverty in Quintana Roo, Mexico for the period 2010-2016. The research question that supports this paper is whether the decrease in extreme poverty and poverty that the federal government of president Enrique Peña Nieto asserted as real is actually an improvement in living and income conditions, or if said decrease takes place at based solely on the criteria with which poverty is defined and measured. To this end, cabinet work was carried out in two parts: The first was a review and analysis of the Guidelines and Criteria for the Definition, Identification and Measurement of Poverty that appear in the Official Gazette of the Federation; and the second in the analysis of the data on deprivation and income that the National Council for the Evaluation of Social Development Policy (CONEVAL) and the National Institute of Statistics, Geography and Informatics (INEGI) offer for 2010-2015 and 2010, 2012 , 2014 and 2016, respectively. Among the most important results, it can be mentioned that, in effect, the average shortfalls of the household in Quintana Roo decreased, however, the income in 2016 remained in conditions similar to those of 2010, that is, the reduction of extreme poverty can be attribute only to state intervention through the creation of infrastructure and not the effectiveness of its economic policies.
KEY WORDS: Poverty; Extreme Poverty; Social Policy; Poverty Measurement; Quintana Roo.
INTRODUCTION
The 2012-2018 sexennium represented for Mexico the return of the Institutional Revolutionary Party (PRI) to power. This resulted in the maintenance of a series of neo-liberal reforms of the most aggressive that the Mexican population has seen since the late 1980s when Carlos Salinas de Gortari was president. Hence, 2018 represents a very important year in the political and economic situation for Mexico. That is why the need arises to know in what conditions the federative entities are, especially in such delicate and urgent matters to solve as poverty. During the 2018 election campaigns in Mexico, the PRI candidate, Jose Meade, raised controversy by ensuring that during his tenure as secretary of social development he had managed to get 2 million Mexicans out of extreme poverty. Rivers of ink ran on the aforementioned statement because the figure seems to dazzle at first sight, however, if the methodology that the National Social Development Policy Evaluation Council (CONEVAL) implements is carefully reviewed, the reality is different.
Given this scenario, it was determined to analyze the behavior of poverty and its indicators in the Caribbean state of Quintana Roo in Mexico in order to determine if poverty decreased in real terms or if the decrease is attributed to the methodological design that CONEVAL has for the measurement of Poverty in Mexico For this, an extensive review was first made of the methodologies implemented in Mexico to typify, measure and identify poverty, as well as the theoretical-conceptual currents that support similar works. In the second section the methodology that was entirely of cabinet is delimited, to finally expose the results and the conclusions.
DEVELOPMENT
In the literature there are important academic efforts that have contributed to the discussion about the correct measurement of poverty. The World Bank poverty reports of 1992 are pioneers on this issue, since it was established that income was the key variable to know the degree of poverty in individuals, that is, the approach was one-dimensional. This naturally unleashed a wave of positions in favor and against the methodology adopted by the World Bank where it was established that having incomes below US $ 1.25 was equal to being poor.
Among the works that emerged as intellectual opposition to this methodology, Sen's (1976, 2000) can be named, who suggested that poverty should be approached from a dual perspective, that is, from the role of the State and in the work of individuals , this he called the approach of freedoms and abilities. Another notable work that is a mandatory reference is that of Alkire and Foster (2007, p. 2) who presented a series of articles for the Oxford Poverty & Human Development Initiative where they propose
“An intuitive approach that uses two types of cut line to identify the poor. The first is the traditional poverty line or cut line based on specific dimensions, which identifies whether a person suffers deprivation in relation to that dimension. The second marks how broad the deprivations that a person suffers to be considered poor should be”.
A methodology that is not widely used but has an interesting logic and position is the one used by the Planning Institute of Jamaica. This Caribbean nation established two variants as a methodology for measuring poverty: public poverty, which refers to the population that has such a lack of income that it cannot even access the goods and services offered by the State; and, private poverty, which refers to the impossibility of consuming food and non-food baskets at real levels (PIOJ, 2007).
Other methodologies for measuring poverty in specific populations can also be mentioned, for example, UNICEF (2000) and Gordon et al. (2003), proposed a methodology to measure poverty in children through indicators that illustrate the degree of deficiencies that this population has, that is, the results will indicate if a child is in a situation of non-deprivation, mild deprivation, moderate deprivation, severe deprivation, or extreme deprivation. This approach is based on the multidimensional principle for poverty measurement. This approach is the same as the Economic Commission for Latin America and the Caribbean (ECLAC) used to propose the Unsatisfied Basic Needs (NBI) method and which is used in Mexico.
Regarding the Mexican case, in the 1980s after the terrible economic results of the sexennia of Luis Echeverria (1970-1976) and José López Portillo (1976-1982) the federal government undertook a crusade to begin designing policies to combat poverty that were already present alarmingly in national statistics. However, no one had been in charge of measuring or estimating the number of poor people in Mexico. This concern was not exclusively Mexican, since all of Latin America and the Caribbean began to feel the ravages of the end of the benefactor state model and the beginning of neoliberalism. In that sense, through the Economic Commission for Latin America and the Caribbean (ECLAC) the phenomenon of poverty was already beginning to be scrutinized in the 1970s by Altmir (1979) who in a vast document proposes to adopt two methods to be able to Measure poverty: the Food Regulations Basket (CNA) and the Poverty Line (LP). In Mexico, the most important work was carried out by the federal government through the General Coordination of the National Plan for Depressed Areas and Marginalized Groups (COPLAMAR). In a series of publications, COPLAMAR inquired about what it considered the categories of analysis that explained poverty:
Food
Household nutritional requierements
Expenditure on food from the Food Regulations Basket
Education
School dropout
Population aged 15 years and over without complete primary
School attendance
Literacy
Living place
Protection
Hygiene
Privacy
Comfort
Functionality
Location
Security of tenure
Health
Access to drinking water and sewerage
Universal care of non-personal health services
Universal extension of non-personal health services
Income
Poverty lines (COPLAMAR, 1982, 1982a, 1982b, 1982c, 1982d, 1982e; Boltvinik, 1990)
This study was closely supported by the poverty measurement methodology that ECLAC began to implement in the 1980s: The Unsatisfied Basic Needs Method (NBI).
Authors such as Feres and Mancero (2001: 65) point out that the NBI method was
“Introduced by ECLAC (…) to take advantage of the information on demographic and housing censuses in the characterization of poverty”. The needs that were considered as dimensions were “i. Access to a home that ensures a minimum standard of habitability for the home; ii. Access to basic services that ensure an adequate sanitary level; iii. Access to basic education; iv. Economic capacity to reach minimum consumption levels” (Feres y Mancero, 2001, p. 67).
This last criterion of economic capacity is inferred in methodologies such as that of Poverty Lines, which according to authors such as Boltvinik (2012) represent normative methods because they include a definition of norms (or thresholds).
This NBI methodology is broken down as follows
“Access to housing
Housing quality
Availability of drinking water
The use of these indicators became regular in Mexico until 2004, when President Vicente Fox promulgated the Social Development Law, which established in article 1, section II as an obligation of the Mexican government to “establish the institutions responsible for social development and define the general principles and guidelines to which the National Development Policy should be subject ”(LGDS, 2004, p. 1). Section VIII of the aforementioned law states that “Mechanisms for the evaluation and monitoring of the programs and actions of the National Social Development Policy” (LGDS, 2004, p. 2) must be established. Likewise, the Regulation of the Law of Social Development in its article 37 establishes in a timely manner that “The persons or social groups in poverty will be those identified by the secretariat, subject to the guidelines and criteria that for the definition, identification and Poverty measurement establish the National Evaluation Council ”(RLGDS, 2004, p. 8). Thus, these legal criteria gave birth to the National Council for the evaluation of Social Development Policy, the body whose responsibility is
to issue the guidelines and criteria for the definition, identification and measurement of poverty based on the information generated by the National Institute of Statistics and Geography (INEGI) through the following indicators: current per capita income, educational lag, access to health services, access to social security, quality and spaces of housing, access to basic services in housing, access to food and degree of social cohesion (CONEVAL, 2016, p. 14).
After the creation of CONEVAL, almost six years later, the General Guidelines of the Federation published the Guidelines and general criteria for the definition, identification and measurement of poverty. This document sets out and outlines all the dimensions, subdimensions, categories and items that the measurement of poverty in Mexico should take into account. In the Second Title of the aforementioned document, The Definition Of Poverty states that
FOURTH.- The definition of poverty considers the living conditions of the population from three spaces: that of economic well-being, that of social rights and that of territorial context. FIFTH.- The economic welfare space will include the needs associated with the goods and services that the population can acquire through income. SIXTH.- The social rights space will be integrated based on the lack of the population in the exercise of their rights for social development (...). SEVENTH.- The social rights space will be integrated based on the lack of the population in the exercise of their rights for social development (...) The social rights space will be integrated based on the shortcomings of the population in the exercise of their rights for social development. EIGHTH.- The population in a situation of multidimensional poverty will be the one whose income is insufficient to acquire the goods and services that it requires to meet their needs and present a lack of at least one of the following six indicators: educational lag, access to the services of health, access to social security, quality and spaces of housing, basic services in housing and access to food (DOF, 2010, p. 2).
Chapter II On the area of economic well-being establishes that:
“TENTH FIRST.- The population in a situation of multidimensional poverty will be one whose income is totally insufficient to acquire the goods and services required to meet their needs and present lack of at least one of the following six indicators: educational lag, access to health services, access to social security, quality and housing spaces, basic services in housing and access to food (DOF, 2010, p. 3),
It is also this chapter that establishes that a distinction must be made between rural and urban areas in the use of the lines of well-being and minimum well-being.
In chapter III Of the social deprivations the criteria are established for each social deprivation to be measured:
I.-In terms of educational backwardness: a) Population aged 3 to 15 years that does not have finished secondary education and does not attend school. b) Population born until 1981 that does not have primary education completed. c) Population born since 1982 that does not have finished secondary education. II.- In terms of access to health services: a) Population not affiliated or registered to receive health services by the Popular Insurance, and that is not the right holder of any social security institution. III.- Regarding access to social security: a) Employed and salaried population that does not receive medical services, disability with pay and SAR or Afore from their work. b) Employed and non-salaried population that does not receive as a labor benefit (…). c) Population without access to social security by one of the first two criteria, which does not enjoy any retirement or pension, or is directly related to a person inside or outside the home with access to social security. d) Population 65 years of age or older that does not have access to social security by any of the above criteria nor is a beneficiary of any social pension program for the elderly. IV.- In terms of quality and housing spaces, the population residing in homes with at least one of the following characteristics: a) The material of most of the floors is land. b) The material of most of the roof is cardboard sheet or debris. c) The material of most of the walls is embarro or bajareque; reed, bamboo or palm; cardboard, metal or asbestos sheet; or waste material. d) With overcrowding. V.- In terms of access to basic services in housing, the population residing in homes with at least one of the following characteristics: a) Water is obtained from a well, river, lake, stream, pipe, or , the piped water is obtained by hauling from another home, or from the public key or hydrant. b) They do not have drainage, or the drain has a connection to a pipe that will give a river, lake, sea, ravine or crack. c) They do not have electricity. VI.- Regarding access to food: a) Population in households with a moderate or severe degree of food insecurity (DOF, 2010, p. 3-4).
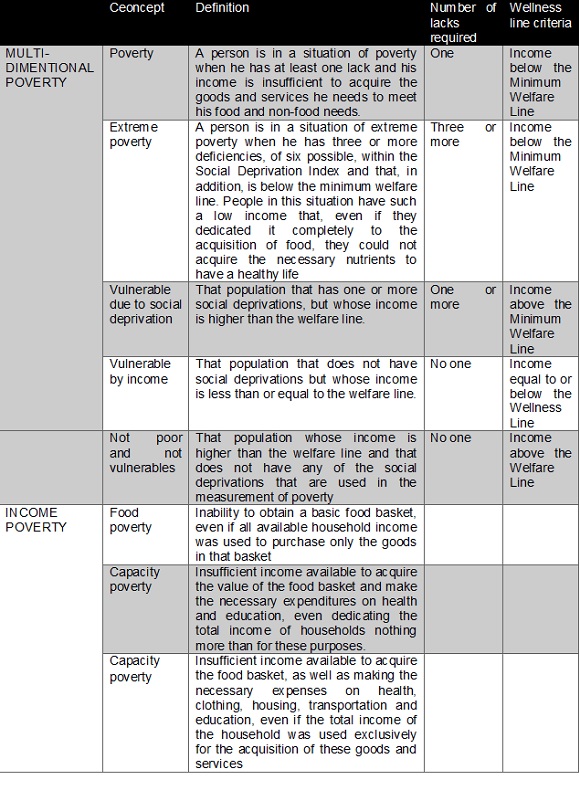
Thus, according to the General Guidelines and Criteria for the definition, identification and measurement of poverty (DOF, 2010), the classification of poverty is due to the number of deprivations that a household owns in combination with its income situation with respect to welfare lines and minimum well-being. According to CONEVAL (2018) and INEGI (2018) it is considered that a person is in a situation of poverty or vulnerability under the criteria outlined in table 1:
Table N ° 1: Poverty typology according to the general guidelines and criteria for the definition, identification and measurement of poverty of CONEVAL
Source: CONEVAL (2018: s/p); INEGI (2018: s/p)
In the academic literature there are important empirical works that address the evaluation of poverty behavior in Mexico. For example Aguilar, Caamal and Portillo (2018) make an interesting disaggregation of multidimensional poverty in Mexico. For their work, they sampled municipalities that have households with incomes below the welfare line, and classified them by clusters so that they could be outlined on maps and that from this point, the pockets of poverty can be regionalized at the national level in order to design and apply differentiated social policies. Another outstanding work in the field is that of González and Barragán (2018) who analyze the poverty conditions that exist in the northern border municipalities of Mexico, emphasizing the behavior of the conditions of the urban neighborhoods that were surveyed in the databases They used for their work. Among the most important results of this article are that although border municipalities have an acceptable behavior in terms of moderate poverty, capacity and heritage given their proximity and relationship with counties in the United States, this stability could be affected by the North American recession that was manifested as of the year 2000 and that, given the arrival of new migrants, it could generate a bubble effect on the amount of extreme poor in the study region.
The work of Herrera and Castro (2018) is very valuable and of academic interest, since these authors propose a survey and logistic regression model to measure poverty in San Andrés Cholula, Puebla, which combines methodologies of the National Population Council of INEGI and of the theory of positive psychology. Among the most important results is on the one hand that income is a factor with a high weight in the regression model, and on the other hand, that in that locality the expenditure on education is high, which prevents households from allocating expenditure to other needs or save. In Campos and Rodas (2019), the authors propose that the fiscal and economic policy must be changed in order to be able to combat in a real way the problem of inequality in terms of income, that is, to improve taxation, especially for households with high incomes; and, focused and coordinated spending to reduce inequality and improve the promotion of social mobility.
Canto (2019) addresses poverty and inequality in Mexico from income. In his work, the author states that much of the problem with poverty has to do with the precarious salary and the inability that some households have to acquire the basic basket. This paper advocates the reorientation of social policies towards “the redistribution of wealth and power to stop the growing social polarization that affects the social and political stability of the country” (Canto, 2019, p. 1204). Another interesting study is that of Torres and Rojas (2015) who present a complete analysis of the poor results of economic and social policy in Mexico based on the implementation of the neoliberal or open economy model, as they call it, because with the Continuous cuts in public spending, there is evidence of the abandonment of management and promotion of development by the State, and the most interesting is how the authors conclude that while social policy continues to be used as a compensatory mechanism for the consequences of the policy economic, there will never be a way to improve the living conditions of the population in poverty.
Barajas (2018) makes an intense review of the historical and budgetary conditions in the policy of combating poverty in Mexico by the Ministry of Social Development, and notes that in Mexico social policy is more oriented to the political issue and Election that to the solution of poverty, or as the author herself puts it, social policy “is not linked to the reduction of poverty in the country, but with the need to give viability to an economic model that generates poor (the programs attend to people who remain outside development), and legitimize the government that promotes such a model” (Barajas, 2018, p. 1). While in regard to studies on poverty in states of Mexico or at the regional level, the work of Székely et al. (2007) who produced an important cartographic report on poverty according to its typologies for all states and municipalities in Mexico. The logic of the study proposed by these authors is based on the assumption that there is statistical bias between the results of the censuses and the ENIGH that INEGI generates. That is why they present a methodology that
“estimates an income model and a heteroskedasticity model based on data from a household survey. In the second stage an income is “imputed” to each of the Census households using the parameter vector obtained in the first stage and the heteroskedasticity model is incorporated to minimize errors in the calculation of income” (Székely et al. 2007, p. 241)
and they conclude that according to their calculations, the highest concentration of poverty and inequality is located in the south of the country, while the least amount of poor and unequal population is on the northern border.
It is important to note that in the specialized literature there is a very significant gap as far as poverty measurement is concerned, specifically in the state of Quintana Roo, it refers. In an electronic review a few articles were found that tangentially touch the phenomenon of poverty in Quintana Roo territory, or do so partially. For example, Toscana and Reyes (2018) propose an analysis of rurality in the Mayan Zone based on the income and the economic structure of the households shown. Among the main results of this work it is worth highlighting that the authors propose a new category of analysis for the population of rural areas that are not peasants, or agricultural proletarians, but dependent on conditional cash transfers. The works of Barrera and Reyes (2013), Reyes and Barrera (2014) and Barrera (2018) address poverty and the effect that conditional cash transfers (CCT) have on income in homes of the Maya ethnic group, mainly in the municipalities of Felipe Carrillo Puerto and José María Morelos, and although the results they show are interesting and pioneering because they show a latent dependence on the homes of study towards CCTs, they have geographical bias because they leave aside the rest of the municipalities of Quintana Roo.
Method
In order to fulfill the objective set, cabinet work was carried out in two parts. First, CONEVAL databases on poverty assessment by state and municipality 2010-2015 were downloaded. From this, information was leaked only from the state of Quintana Roo and its municipalities in order to analyze data on poverty, extreme poverty, vulnerable due to deficiencies, vulnerable by income, and all the deficiencies that CONEVAL typifies. This allowed to account for the situation of poverty in the field of dimensions.
To analyze the question of economic well-being or income, they downloaded the social conditions modules of the ENIGH 2012, 2014 and 2016 (INEGI, 2013, 2015, 2017) in order to analyze the Current Income (CI) variable. This variable is broken down into 1. Work Income; 2. Property Income; 3. Transfers; 4. Estimation of rental of housing; and 5. Other Current Income (INEGI, 2015). The CI will serve as a means of contrast to know if the behavior of poverty in any of its variants is explained by the dimensions that make it up or by how the CI moved.
It is important to note that, despite the constant criticism of statistical and geographical bias (Székely et al. 2007; Damian, 2007) at the micro level that ENIGH has, this survey is the only source of information at the national level that is generated in Mexico continuously, because previously, almost all the information was obtained from the censuses every decade. Now, the ENIGH, according to INEGI (2014, s / p)
“It is characterized by being probabilistic; consequently, the results obtained from the survey are generalized to the entire population. At the same time it has a two-stage, stratified and conglomerate design, where the last unit of selection is the home and the observation unit is the home”.
Without this survey, information regarding household perceptions and expenses would be reduced to databases resulting from individual and highly focused academic efforts that would result in heterogeneous information and with even more bias than what is currently criticized. Thus, the database that was worked for this document and that addresses the total of the state of Quintana Roo (Map 1) was composed as follows:
ENIGH 2016à 1,728 households in total (2.4% of the national sample)
or 87 in Cozumel, 61 in Felipe Carrillo Puerto, 6 in Isla Mujeres, 414 in Othón P. Blanco, 792 in Benito Juárez, 61 in José María Morelos, 22 in Lázaro Cárdenas, 216 in Solidaridad, 69 in Tulum.
ENIGH 2014à 517 households in total (2.4% of the national sample)
or 36 in Cozumel, 18 in Felipe Carrillo Puerto, 16 in Isla Mujeres, 93 in Othón P. Blanco, 239 in Benito Juárez, 20 in José María Morelos, 57 in Solidaridad, 28 in Tulum
ENIGH 2012à 277 households in total (2.7% of the national sample)
or 22 in Felipe Carrillo Puerto, 20 for Isla Mujeres, 80 for Othón P. Blanco, 135 in Benito Juárez, 20 for Solidaridad
Map N°1. The study región, Quintana Roo, Mexico
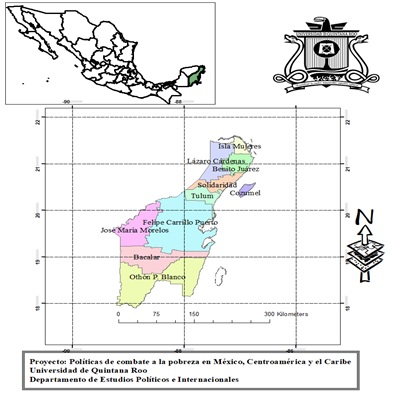
Source: Own elaboration in Arc Map
Results
As can be seen in Table 2 and 3, the decrease in the number of people in all types of poverty in the municipalities of Quintana Roo is very low, 14 of 45 data had negative growth rates. In fact, the most notable result is that of Tulum in terms of Vulnerables by income with -37.2% and Othón P. Blanco in Extreme Poverty with -35.7%, on the contrary it is alarming the increase of vulnerable by income of José María Morelos, Felipe Carrillo Puerto (municipalities with a high concentration of population belonging to the Maya ethnicity) and Cozumel with 107.4%, 76.3 and 71.4%.
Table N°2. Poverty matrix for municipalities of Quintana Roo (2010-2015)
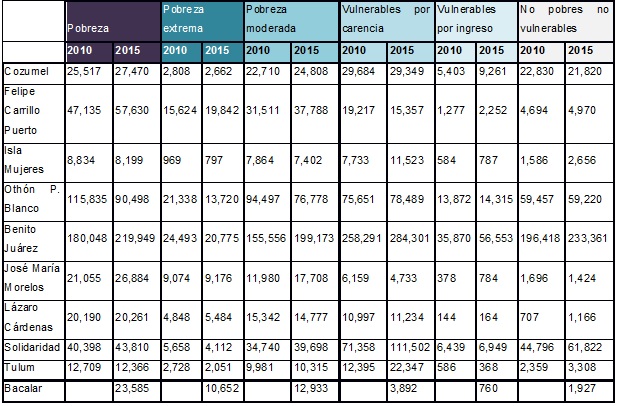
Source: Elaboration with data from CONEVAL (2018)
Table N°3: Growth rate 2010-2015 by type of poverty for municipalities of Quintana Roo
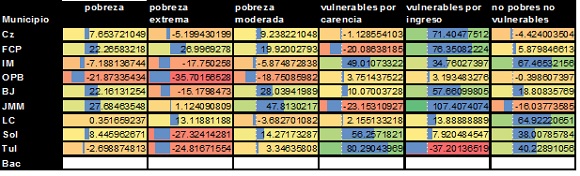
Source: Elaboration with data from CONEVAL (2018)
In order to understand whether the decrease in poverty and extreme poverty indicators, as well as the moderate and vulnerable ones due to social deprivation, it is necessary to examine Table 4 which contains the behavior of the average number of deprivations by type of poverty. There, it can be seen that in the area of poverty, only Isla Mujeres did not have a lack of deficiencies and Lázaro Cárdenas remained the same. Regarding extreme poverty, Isla Mujeres and Othón P. Blanco remained unchanged, while Solidaridad was the only one that increased their deficiencies. In the area of moderate poverty Isla Mujeres increased its deficiencies, while the rest remained the same or with decreases. In the Vulnerable category due to social deprivation, only Isla Mujeres and Lázaro Cárdenas registered an increase in deficiencies.
Table N°4. Average deficiencies 2010-2015 by type of poverty or vulnerability in municipalities of Quintana Roo
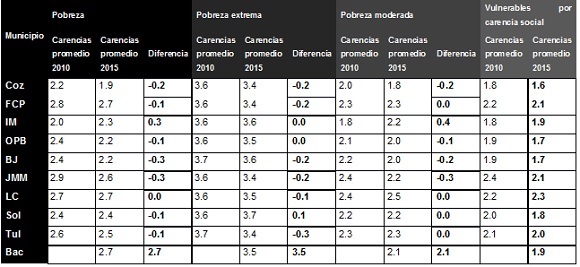
Source: Elaboration with data from CONEVAL (2018)
Graph 1 shows the growth rate by municipality of each poverty classification. It is striking that, in effect, as the federal authorities have mentioned, extreme poverty growth rates are negative for almost all municipalities, except Felipe Carrillo Puerto. In addition to that the growth rates for poverty are also negative or very low considering that if the rates of extreme poverty decreased, it is natural that those of poverty increase given the mobility between classifications. In this same graph, attention is drawn to the behavior that the growth rate of the vulnerable population had by income, that is, those who do not have deficiencies but whose income is low. In that case only Tulum registers negative rates, while Solidaridad and Lázaro Cárdenas have low positive rates, however, two municipalities with a very high tourist activity not only national but international, Benito Juárez and Cozumel, register positive rates of 51% and 71% respectively. This calls into question the benefits of the employment and wealth generation model through tourism, because, although the deficiencies in both municipalities decreased, the income is not enough for the population
Graph N°1. Growth rate by poverty classification in Quintana Roo (2010-2015)
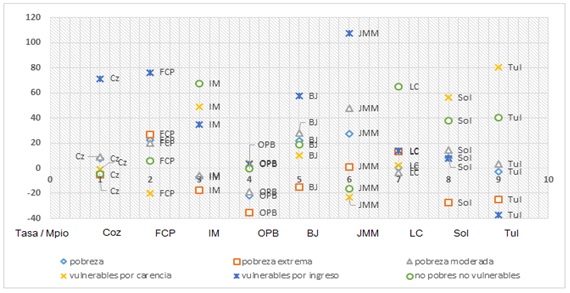
Source: Elaboration with data from CONEVAL (2018)
However, in graph 2 it is quite clarified what graph 1 reveals, therefore, the deficiencies suffered by all the municipalities in Quintana Roo can be seen in greater detail. The most striking fact is the 650% increase in lack of housing services in the municipality of Solidaridad, which can be explained by the demographic boom that Playa del Carmen has had as the heart of the Riviera Maya. This has caused massive migration towards this point that, as evidenced by the graph, did not have sufficient housing infrastructure with basic services, hence the appearance of irregular colonies in this town (Camacho, 2015; Castillo and Méndez, 2017). Another striking fact is that, on the one hand, the growth rates of lack of basic housing services were around 100% in the case of Tulum (120%), Lázaro Cárdenas (98.2%) and Felipe Carrillo Puerto (82.4%). On the other hand, food deficiency had high growth rates in Isla Mujeres (136.7%) and Benito Juárez (56.7%). It should be noted that the more rural municipalities do not have high rates of food deficiency, when they did show high growth rates in income vulnerability. This can be explained by backyard agriculture and livestock, especially in indigenous locations. The rest of the deficiencies had normal and even negative growth rates, for example Othón P. Blanco in health services registered -45.2% and in housing -39.2%.
Graph N°2. Growth rate of deficiencies and vulnerability due to income in Quintana Roo (2010–2015)
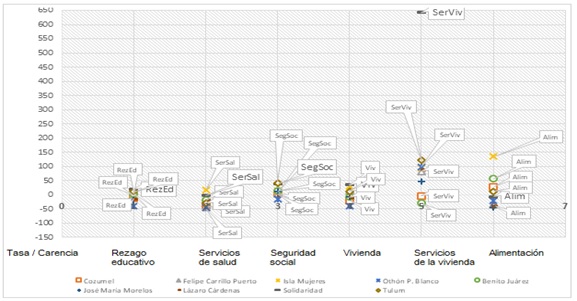
Source: Elaboration with data from CONEVAL (2018)
Regarding the growth rates of the vulnerability indicators by income or lack, graph 3 shows that Tulum and Lázaro Cárdenas registered an increase of about 40% in the number of households that have less than one lack, which is extremely positive. The only one who had problems with this indicator was Othón P. Blanco, who registered a drop of -11.7%. With regard to households that presented more than 3 deficiencies, Isla Mujeres had the highest growth rate (68.3%), followed by Solidaridad with 23% and Tulum with 17%, while municipalities such as Cozumel (-21.2%) and Othón P. Blanco (-24.89%) presented a decrease in the number of households with more than three deficiencies. In the household with income below the welfare line, Lázaro Cardenas (0.45%), Solidaridad (8.3%), Cozumel (18.79%), Felipe Carrillo Puerto (23.69%), Benito Juárez (29%) and José María Morelos (30.1%) had an increase in the number of households in this condition. Again, the problem of fighting poverty, as evidenced by the above, is not the lack, it is income. The above is sustained by observing the growth rate of households with incomes below the minimum welfare line, in that sense, the indigenous municipalities Felipe Carrillo Puerto (37.8%) and José María Morelos (34%) were the municipalities with the highest growth rate. Cozumel and Lázaro Cárdenas also had positive rates with 17.8% and 16.5%, respectively. Cancun had the smallest negative rate of just -0.09%, which is to call attention to the amount of tourist employment generated there. And the municipality with the highest number of households managed to improve their income above the minimum welfare line was Isla Mujeres with -39.9%.
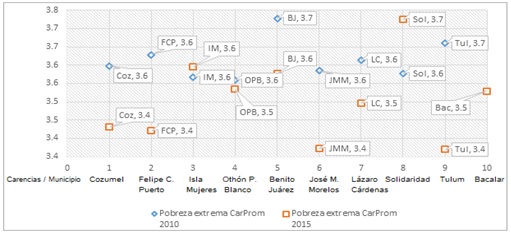
Graph 4 and 5 show the behavior that the combined average deficiencies had in the population with poverty and extreme poverty, that is, the CONEVAL for each registered deficiency counts the average deficiencies that are in addition to the one analyzed. For example, those who lack educational lag may have extra average deficiencies. In that sense, graph 4 and 5 end up reinforcing the idea that the improvement of the conditions of poverty and extreme poverty in Mexico and Quintana Roo occurred only through solving the deficiencies and not of a real improvement in income. In fact all municipalities had a decrease in average deficiencies, except Solidaridad.
Graph N°3. Vulnerability growth rate by income for Quintana Roo (2010 - 2015)
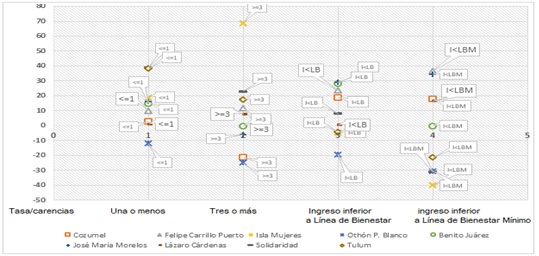
Source: Elaboration with data from CONEVAL (2018)
Graph N°4: Average deficiencies in population living in poverty in Quintana Roo (2010-2015)
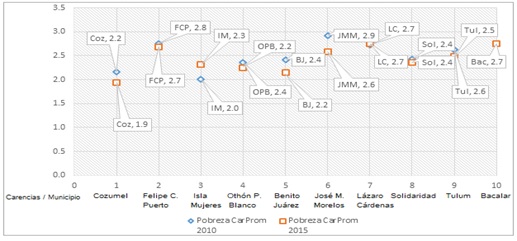
Source: Elaboration with data from CONEVAL (2018)
Graph N°5. Average deficiencies in population in extreme poverty in Quintana Roo (2010-2015)
Source: Elaboration with data from CONEVAL (2018)
Graph N°6. Average deficiencies in population in moderate poverty in Quintana Roo (2010-2015)
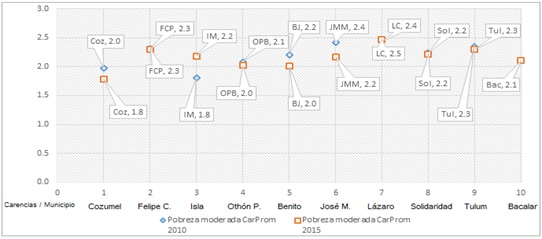
Source: Elaboration with data from CONEVAL (2018)
Graph N°7. Average deficiencies in population in situation of vulnerability due to social deprivation in the municipalities of Quintana Roo (2010-2015)
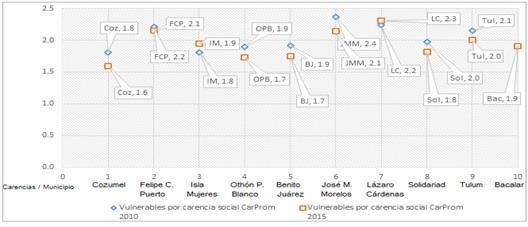
Source: Elaboration with data from CONEVAL (2018)
Regarding income as the complementary variable for the measurement, identification and classification of poverty, it is shown that in graph 8 the structure of income for the period 2010-2016 can be seen, it clearly shows that the income from of the work in 2016 has a percentage of participation barely higher than in 2010 with a noticeable fall in 2014; while the proportion of income from income increased during the study period, registering the same drop in 2014 as income from work. Transfer income filled the gap in the structure of current income that income from work and income left in 2014.
Graph N°8. Income structure in Quintana Roo (2010-2016)
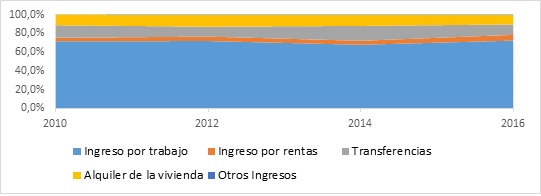
Source: own elaboration with data from INEGI (2011, 2013, 2015b, 2017)
Figure 9, where the current income data were accommodated per year from the youngest to the oldest, is key to the analysis because it realizes that the current income, that is, the sum of all the income that a household receives, has not had great variation in the period 2010-2016, in fact, if not for the pair of outlayers in 2014, which incidentally show income inequality, the tendency is to remain static or decrease. If the maximum data were eliminated in the 4 observations, the large bulk of households have similar incomes.
Graph N°9. Current Income in Quintana Roo (2010-2016)
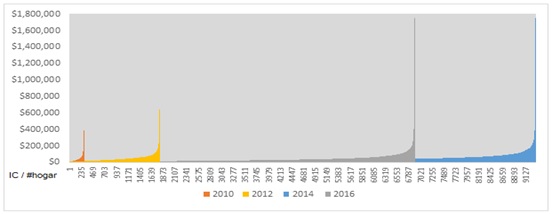
Source: Own elaboration with data from INEGI (2011, 2013, 2015b, 2017)
CONCLUSION
As illustrated in this paper, it is clear that, at least in the case of Quintana Roo, the reduction of poverty is more attributed to issues related to overcoming the deficiencies defined in the Guidelines and Criteria for the Definition, Identification and Poverty Measurement that CONEVAL published in the Official Gazette of the Federation and not of an obvious improvement regarding income. That is to say, the two million of the extreme poor that the former Secretary of the Treasury and Public Credit and former presidential candidate, José Antonio Meade, announced had disappeared, did so only by overcoming deficiencies. That is, they left extreme poverty to be poor or at best vulnerable by income.
The problem with the above is that as evidenced in the work, the number of poor people did not decrease and the number of vulnerable people by income increased. This supports the claim that poverty was overcome only from deficiencies and not from improved income. It will be interesting to make a new evaluation of poverty data in 2021 when CONEVAL generates its five-year report and INEGI has presented the data of the ENIGH 2018 and 2020. These data will allow to know even more deeply the results of the policies to combat the poverty that the neoliberal governments of the last two six years in Mexico have implemented.
It is expected on the one hand that this work contributes to the discussion on the situation of poverty in Mexico, especially because it addresses this phenomenon from a state perspective; and on the other hand, that public decision makers are urged to have information that helps them to understand from the academic perspective the failures they have had in the design of public policies. As in this case, we tried to solve the problem of poverty through overcoming deficiencies and not improving income.
REFERENCES
Please refer to articles in Spanish Bibliography.
BIBLIOGRAPHCIAL ABSTRACT
Please refer to articles Spanish Biographical abstract.