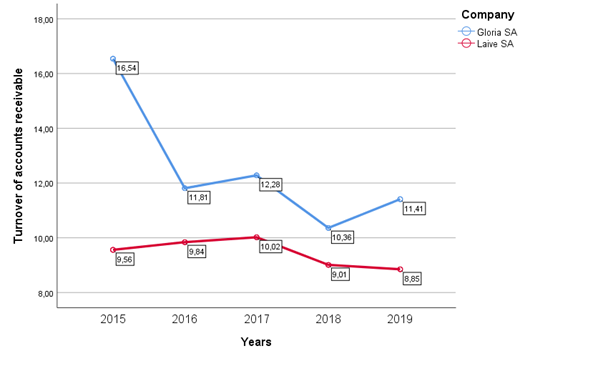
Figure N ° 1. Comparative analysis of the turnover of accounts receivable
Source: Own Elaboration from BVL data (2015 - 2019)
(*)Carlos Alberto Vásquez Villanueva; (**)Otto Franklin Terry Ponte; (***)Marylin Jhosmit Huaman Tito; (****)Carlo Stefano Cerna Carrazco
(*)Cesar Vallejo University
Lima, Perú
carlosvasquezv19@gmail.com
(**)Cesar Vallejo University
Lima Perú
ottoterry@gmail.com
(***)Cesar Vallejo University
Lima, Perú
mhuamanti@ucvvirtual.edu.pe
(****)Cesar Vallejo University
Lima, Perú
ccernaca99@ucvvirtual.edu.pe
Reception date: 01/11/2021 – Approval date: 03/16/2021
DOI IN PROCESS
ABSTRACT
The purpose of the study was to analyze accounts receivable and liquidity in dairy sector companies listed on the BVL; The methodology used was descriptive - comparative, of a non-experimental design with a cross section. The technique that was used was the documentary analysis and the analysis sheet was used as an instrument; On the other hand, the non-probabilistic sample consisted of 20 annual financial statements, in turn made up of two companies in the dairy sector from 2015 to 2019; On this basis, the financial comparison indicators were calculated. The results determined that the company Leche Gloria SA, managed to obtain a better collection sufficiency due to the speed in the recovery of its loans granted, while Laive SA was slow to recover the cash from the sales made; Regarding liquidity, the two companies had good payment capacity to meet their obligations and short-term debts, exceeding the estimated range. It was concluded that by having good collection standards, companies obtain considerable liquidity to make the corresponding payments and avoid production stagnation according to economic activity.
KEY WORDS: Accounts Receivable; Liquidity; Financial ratios.
INTRODUCTION
International dairy companies have had significant economic growth, for this reason it is considered one of the industrial groups with the highest annual economic flow in the food sector; regarding the above, Saíz Bear (2017) points out that the demand is the main factor of productive increase and the reason why credit sales have been increasing over time. The international scenario shows that 101 dairy companies in Europe have been taking commercial measures that help to maintain an average of a minimum range of 80% in immediate liquidity, in order to meet their financial obligations, which means that the growth of sales in companies generates greater liquidity, adopting a continuous monitoring for the fulfillment of short-term debts according to the payment capacity.
In addition, there are differences in the treatment of liquidity in the types of international companies, this is important to determine parameters for the results obtained, Amat Salas (2017) describes 75 of the best dairy companies in Europe in 2017, of which points out that medium and large producers have an average liquidity of 1.52% compared to 1.60% of small companies; Related to this, it is highlighted that accounts receivable have an average of 45 days in the collection process, this information is relevant if it seeks to improve the management of liquidity in the face of business obligations.
In the national context, the dairy sector is one of the most important activities in the economy with the poultry and livestock industry, which represents an important source of employment generation due to growing demand. Pineda Portugal (2014) mentions that the companies Nestlé SA, Leche Gloria SA and Laive SA provide 90% of the market, the remaining 10% is made up of artisan producers; That means, it is important to determine the level of sales that are made annually to higher income generation.
This has agreement with what is recommended by Solano Durán (2018), who states that using financial tools can improve the economic character of accounts receivable, seeking to reduce them to 15%, which requires a follow-up function to clients for the respective collection by various ways, as this involves an asset that can be quickly transformed into monetary cash. Due to this, the industrial companies of the dairy sector are very important in the economy as well as in the health of each country, improving the economic growth rate.
At the local level, the dairy companies that were used to carry out the research report, according to the latest information from the Bolsa de Valores de Lima (2020), were the company Laive SA, located in the district of Ate, which is dedicated to the elaboration of milk and its derivatives such as yogurt, cheese, butter, among other merchandise for sale and distribution nationwide. The company in the 2019 period had as a result a liquidity index of 1.09 with respect to current assets over current liabilities; Regarding accounts receivable (S/ 67'610,000), on this Bendezú Rivera (2019) refers that the company's accounts receivable 6 years ago were greater than accounts payable by 55.80%, which generated a Low liquidity ratio of the 48% established average, with consequences of drastically changing the way of managing their accounts receivable.
For its part, the company Leche Gloria SA, located in the district of La Victoria, is dedicated to the preparation, packaging, manufacture, purchase and sale, import and export of products derived from milk, products composed of fruits and vegetables, among others. In the 2019 period, it obtained a liquidity index of 1.60 and accounts receivable with an equivalent (S/ 300'090,000). Córdova Pacheco (2018) mentions that in recent periods the company shows an average liquidity level of 77%, which has a standard coverage of its short-term financial obligations. Regarding accounts receivable, he mentions that credit policies are more aggressive year after year, being slightly lower than accounts payable until 2017.
All the above verifies the importance of conducting an analysis of accounts receivable in those periods, this will help determine the successes and weaknesses of the activities that were used to improve the liquidity of industrial companies in the dairy sector. For this reason, and through a descriptive analysis, the following problem was formulated: What is the financial situation of accounts receivable and liquidity in the dairy sector companies that are listed on the BVL? And from this, the specifics branch off: What is the status of accounts receivable, in companies in the dairy sector that are listed on the BVL? And What is the status of liquidity, in companies in the dairy sector that are listed in the BVL?
The purpose of the report was to analyze the accounts receivable and liquidity of the dairy sector companies listed on the BVL and compare the results and determining factors. In addition to this, it was possible to identify which company best uses its strategies or resources in order to obtain better results against the competition, as well as the determination of variants in economic activities, when liquidity is generated before financial obligations in each period. It is also important because it gives the opportunity to explore a reality with different points of view, applying it in an original, innovative report that provides knowledge about a problematic situation.
The beneficiaries of this study are the shareholders at the time of investing capital in the listed entities, the same companies that will be able to obtain detailed knowledge about the factors that affect the results, as well as other researchers who can carry out this type of report. On the other hand, it is stated that the investigation is viable because the information obtained is freely accessible and the necessary resources are available for its realization.
Due to the aforementioned, the purpose of the study is to analyze the scope of accounts receivable and liquidity through financial ratios, in companies in the dairy sector that are listed on the BVL.
DEVELOPMENT
Main theoretical bases
Accounts receivable are extremely important to organizations because it is a source of monetary income and key to maintaining healthy cash flow. Guajardo Cantú and Andrade de Guajardo (2014) indicate that it is an economic resource, properties and rights of each company, from which some short-term benefit can be generated. In other words, this asset can generate profits by keeping track of the proper management of collections, which will help the company to improve the growth of its sales and liquidity.
In addition, it is the credit obligation for the purchase of goods or services subscribed by a client, at the same time it can be short or long term; Stam and Westerman (2018) argue that it is an investment with clients through commercial credit and the way this credit is managed influences collection to avoid arrears. On the other hand, Munene (2018) infers that they have an important aspect in finance, because it proportionally affects liquidity and profitability; likewise, it has principles in which companies should be governed to evaluate the payment capacity of customers with aging accounts receivable, using criteria to analyze the economic condition when establishing commercial credits, evaluations of the risk of default so as not to affect the soundness financial therefore, both authors show how vital the accounts receivable are for the operation of the company in the face of financial obligations through the collection of their respective clients.
As dimensions of accounts receivable, the following were considered:
The rotation of accounts receivable is important to have control over the collections that must be made to increase the cash in the company. Pandoyo (2019) defines the rotation of accounts receivable as a measure of the number of times, in which a company makes its collections during the accounting period; This can be calculated by dividing sales with accounts receivable in each year of investigation. This suggests that this ratio helps to average the times that a company can convert its receivables to money to increase liquidity in the period.
The average collection period allows to know the number of days that the company takes to collect the required asset. Wafula et al. (2019) define what is the period in days that a company takes to charge its customers; in other words, this indicator shows the average number of days it takes for the clients being financed to pay, therefore, it is important for the entity to consider the time it takes to collect the cash.
It is essential to determine a prudent collection period to avoid an accumulation of uncollectible accounts in the future; in this regard, Ortiz Taipe (2019) mention that the average collection period is the period in which the client takes to make the payment of the sale, this must be relevant since it will be measured through accounts receivable between sales to credit for the days of the year. This indicator helps to measure the average number of days that a company uses to collect from debtor customers for the sale of a good or service on credit.
The liquidity variable is very important in companies since it is a tool to control the ability to take responsibility for their debts with third parties. Peralta Gamboa (2018) points out that liquidity is the volume that companies must be able to face their debts and financial obligations in certain periods with the amounts established with suppliers, clients and financial entities with whom short-term economic operations are carried out. That is, it helps to maintain a parameter that must be met to comply with activities throughout the work period.
The importance of optimal liquidity being essential for all companies is highlighted, due to its condition as a solvency meter to pay off financial obligations in each period of activity. Opuku Ware (2015) indicates that the decisions to be applied in a management that influence the effectiveness of liquidity, gives priority to the management of current assets, current liabilities and the existing correlation; it also implies planning and controlling current assets to such an extent that it eliminates the inability to meet short-term obligations, for which a constant control must be had in the different types of branching indicators of this variable.
The tools that can help are the liquidity ratios, since they measure different points within the liquidity according to the assets that are owned. Durrah et al. (2016) define liquidity as the speed of transfer of assets to cash, where certain indicators measure the ability of companies to meet their short-term financial obligations. The results give a better understanding of the state of companies in the financial market.
As dimensions of liquidity, the following are observed:
Current liquidity helps measure the capacity of a company with its assets and liabilities pertaining to an accounting period. Castañeda Vásquez (2018) state that current liquidity is an indicator that reflects the entity's technique to be able to pay debts at a certain time, since the higher the result, the better the company's ability to take care of its debts. The ratio is based on result 1, if it is higher it has good payment capacity, if it is the same it can cover its debts and if it is lower it has poor capacity due to lack of liquidity. Likewise, it helps to maintain an optimal level for the fulfillment of your current financial debts.
Therefore, this ratio provides a broader picture of the management of resources within an accounting period. Moreno Fernández (2014) indicates that current liquidity is determined by dividing the value of current assets by the value of current liabilities and as a result, the number of times the asset has over the liability; so, controlling this indicator gives more opportunities to manage the cash for the fulfillment of the costs for the operation of the company.
The acid test indicates the ability of the company with its liquid assets excluding inventory, to cover its short-term debts. Marsha and Murtaqi (2017) express as a more conservative interpretation of the current liquidity index, although this ratio provides a more rigorous evaluation of the ability of a company to pay current liabilities, including the elimination of inventory in the formula, considered the least liquid and convertible to cash of current assets, from which it is more probable to obtain losses; therefore, it helps to measure the best conversion liquid asset to meet financial obligations.
On the other hand, Herrera Freire et al. (2016) indicate that this ratio is similar to the solvency ratio, but at the same time it is the least liquid asset since inventory is not taken into account within current assets. That is, this ratio is the least liquid because inventories are not considered.
The defensive test helps to generate a result with only the monetary and checking account cash to be able to take care of the short-term debts. Wiwik Afridah (2018) defines the defensive test as a measure of the capacity that a company has when paying short-term obligations with the most liquid available and current accounts in financial institutions. The indicator allows giving a more detailed margin with the most financially liquid asset to cover liabilities with third parties in the short term.
Methodology, presentation and analysis of data
The sample for this study consisted of 10 statements of financial position and 10 statements of income of two companies in the dairy sector, such as Laive SA and Leche Gloria SA that are listed on the Lima Stock Exchange from 2015 to 2019. Taherdoost (2017) defines the sample as a relevant characteristic of an investigation, with the objective of making inferences to a population through the sample to avoid errors under an adequate size. Therefore, the sample is a representative part of the population that is chosen by factors in the research.
Non-probability sampling was used for convenience, since the selected companies were easily accessible due to the financial information that they publicly expose. Otzen and Manterola (2017) define non-probability category sampling techniques as a choice of subjects for the analysis, which will be subjected to certain characteristics or criteria that are necessary and from where researchers can obtain valid or reliable results for not conform to a fortuitous certainty, which is why it is important to perform an analysis without altering the results obtained naturally in an investigation.
The Peruvian companies that were taken into account for the study are:
LAIVE S.A., located in the district of Ate and LECHE GLORIA S.A., in the district of La Victoria, both residents and listed on the Bolsa de Valores de Lima.
The study carried out was of a descriptive comparative type, because it relates procedures and factors that were taken into account for these variables among various subjects. Díaz Narváez and Calzadilla Núñez (2015) mention that this type of research operates when measuring the characteristics, components or dimensions in order to obtain the highest precision of the study. In contrast to the author, the description was chosen for the ability to reflect in detail the reality of the financial situation in both Lima companies in the dairy sector, so the research aims to focus on the collection of data that describe the situation of the variables for identify what actions each entity takes when managing its finances.
The technique used in the report was the documentary analysis, because the Statement of Financial Position and the Statement of Income for the years 2015 to 2019 of the companies in the dairy sector that are listed on the Bolsa de Valores de Lima were analyzed. Gómez Rodríguez et al. (2016) indicate that the documentary technique are mechanisms and instruments that are used to gather and measure information in an organized way and that also allow the collection of information to state the theories that support the study of phenomena and processes. It is understood that the technique is a set of tools and means used to implement the method, which is only applicable to science.
Next, the variable accounts receivable in the financial field was analyzed by means of ratios according to its dimensions, which are the turnover of accounts receivable, consulting the data of the BVL, a variation was verified between the companies of the dairy sector according to the figure presented below:
Figure N ° 1. Comparative analysis of the turnover of accounts receivable
Source: Own Elaboration from BVL data (2015 - 2019)
According to figure 1, it is observed that in the period 2015 to 2019, the lowest turnover values of accounts receivable, in dairy production companies, related to the company Laive SA with rates of 9.56 in 2015, 9.84 in 2016, 10.02 in 2017, 9.01 in 2018 and 8.85 in 2019. The highest values in the entire period 2015 to 2019 were registered by the company Gloria SA with indicates of 16.54 in 2015, 11.81 in 2016, 12.28 in 2017, 10.36 in 2018 and 11.41 in 2019. On the other hand, the average value for account turnover receivable was higher for the company Gloria SA with 12.48; For its part, Laive SA presented an average turnover ratio of accounts receivable of 9.46.
In relation to the 2015 report, obtained from the Lima Stock Exchange website, it was observed that the company Gloria SA evidenced having greater capacity and better control to make collections 17 times annually. This was because they have well-established collection policies, where the credit treatment with clients was from 8 to 60 days, with 80% of the invoices not yet due at the end of the period.
On the other hand, in the opinion of Laive SA in 2017, being lower than the other company, it has a collection turnover level of 11 times, because some accounts receivable are guaranteed by means of guarantee letters, deposits in collateral and mortgages (S/.39'354,000) after having determined the deterioration of almost 20% that exceed the term greater than 180 days of expiration.
Consequently, the average collection period had a considerable variation in the evaluated years of the dairy sector, as shown in the following figure:
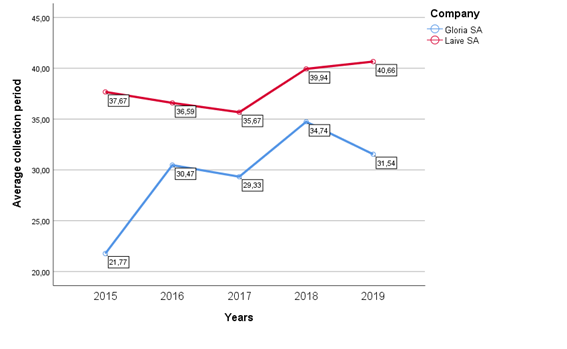
Figure N ° 2. Comparative analysis of the average collection period
Source: Own Elaboration from Lima Stock Exchange data (2015 - 2019)
According to figure 2, within the period 2015 to 2019, the lowest values of the average collection period, in dairy production companies, correspond to the company Gloria SA with 21.77 in 2015, 30.47 in in 2016, 29.33 in 2017, 34.74 in 2018 and 31.54 in 2019; On the other hand, the highest values in the entire period 2015 to 2019 were registered by the company Laive SA with 37.67 in 2015, 36.59 in 2016, 35.67 in 2017, 39.94 in 2018 and 40 , 66 in 2019. Also, the average value for the average collection period was higher for the company Laive SA with 38.11; For its part, Gloria SA presented an average of 29.57.
In relation to the opinion of the year 2019, the company Laive SA had an average collection period of 41 days, because the sales made to distributors and supermarkets have a credit of 14 to 60 days, to whom the company performs an evaluation of credits 2 times a year. In addition, the company had accounts receivable that were guaranteed by letters of guarantee and guarantee deposits (S / 47,977,000).
Relating to Gloria SA, it was reflected in 2018 that it had 35 days in its average collection period in the last 5 years, due to the fact that they had better management of loans granted and collections in less time, counting with 71% of sales not yet due. The company estimated a doubtful collection (S / 18'637,000), which consequently the management used the guarantees deposited by the clients to control the deterioration of the collections.
Regarding the liquidity variable, there is the first dimension where it is shown that the companies are favorable passing the estimated range, according to the following figure:
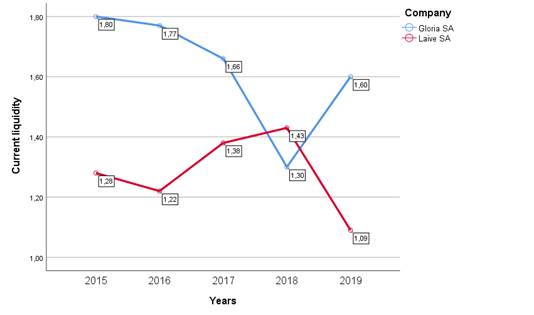
Figure N ° 3. Comparative analysis of current liquidity
Source: Own Elaboration from Lima Stock Exchange data (2015 - 2019)
Figure 3 shows the current liquidity indexes in the companies of the dairy productive sector in the period 2015 to 2019; the highest values were registered by the company Gloria SA, starting with 1.80 in 2015, which represents the highest current liquidity index within the period, 1.77 in 2016, 1.66 in in 2017 and 1.60 in 2019; On the other hand, the lowest current liquidity values were registered by the company Laive SA, with 1.28 in 2015, 1.22 in 2016, 1.38 in 2017 and 1.09 in 2019; It should be noted that in 2018 the result was reversed for the two companies, Laive SA surpasses Gloria SA with a current liquidity index of 1.43 and Gloria drops to an index of 1.30. Also, the average was higher for Gloria SA with an index of 1.62, compared to the current liquidity index of 1.28 obtained by Laive SA.
According to the opinion of that year Gloria SA had the highest point in 2015 with a result of 1.80 percentage points, this means that the ability to cover its short-term financial obligations is vast, since it would have 80% more in current assets after settling current liabilities. This is because inventories are equivalent to 53% of the short-term assets, especially the cost of raw materials, auxiliaries and other inputs which is equivalent to 33% and the raw and auxiliary materials to be received in the next quarter. In 2018, the lowest result was 1.3 because despite having maintained a high inventory; in current liabilities we find an increase in trade accounts payable by 40%.
As for Laive SA, the highest point was in 2018, with a result of 1.43 due to the fact that in current liabilities there was an increase in accounts payable, due to the purchase of raw materials and supplies for manufacturing, including finished products in the warehouse ready for sale. The lowest point was detailed in 2019 with 1.09 of current liquidity, because despite having a high percentage in inventory and accounts payable, accounts receivable is what determines the decrease in this period.
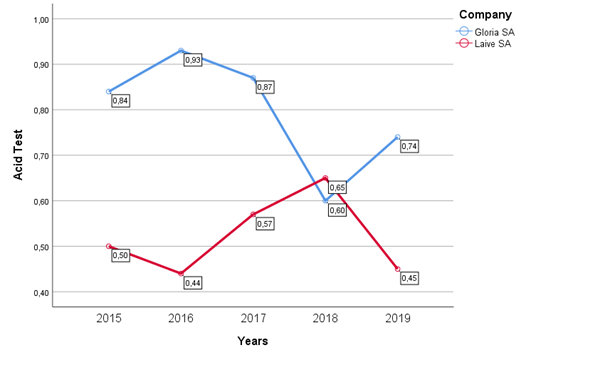
Figure N ° 4. Comparative analysis of the Acid-Test
Source: Own Elaboration from Lima Stock Exchange data (2015 - 2019)
Figure 4 shows the Acid-Test indices of companies in the dairy productive sector in the period 2015 to 2019; the highest values were recorded by the company Gloria SA, starting with 0.84 in 2015, 0.93 in 2016, which represents the highest acid test index within the period, 0.87 in in 2017 and 0.74 in 2019; On the other hand, the lowest acid test values were registered by the company Laive SA, with 0.50 in 2015, 0.44 in 2016, 0.57 in 2017 and 0.45 in 2019; It should be noted that in 2018 the result was reversed for the two companies, Laive SA surpasses Gloria SA with an Acid-Test index of 0.65 and Gloria drops to an index of 0.60.
According to the 2016 opinion of Gloria SA, this being the one that showed the highest level of acidic liquidity in the capacity to cover its current obligations due to the fact that this financial indicator excludes inventories and in this case it is equivalent to 47% of assets current, leaving a total (S/ 740'082,000) equivalent to 93% to cover current liabilities of a total of (S/ 792'497,000) this means that it has the resources such as accounts receivable equivalent to 21%, to cover most of your short-term debts.
In the case of Laive SA, the maximum point that reached in these last 5 years was in 2018, and the opinion of that year details that inventories are equivalent to 54% of total current assets, excluding it, a balance of (S/ 84´180,000). This result can cover 65% of total current liabilities. Incredibly, this is the only period that Laive SA exceeds Gloria SA by 5% in financial acid liquidity, as a result of inventories covering 55% of current assets, being responsible for the decline in the trend.
The defensive test, details a wide variation between the companies evaluated in the sector obtaining unfavorable results, as shown below:
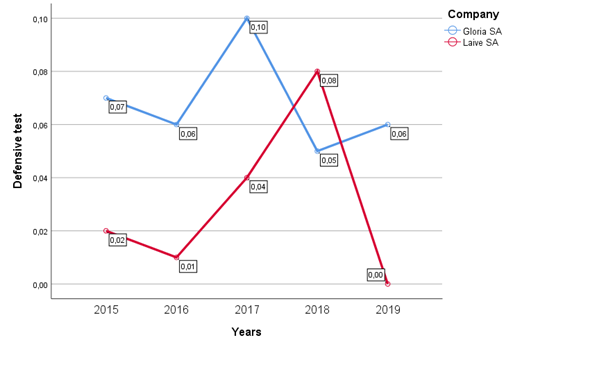
Figure N°5. Comparative analysis of the defensive test
Source: Own Elaboration from Lima Stock Exchange data (2015 - 2019)
Figure 5 shows the defensive test indices of companies in the dairy productive sector in the period 2015 to 2019; the highest values were registered by the company Gloria SA, starting with 0.07 in 2015, 0.06 in 2016, 0.10 in 2017 which represents the highest defensive test index within the period and 0.06 in 2019; On the other hand, the lowest defensive test values were registered by the company Laive SA, with 0.02 in 2015, 0.01 in 2016, 0.04 in 2017 and 0.00 in 2019; It should be noted that in 2018 the result was reversed for the two companies, Laive SA surpasses Gloria SA with a defensive test index of 0.08 and Gloria descends to an index of 0.06. Also, the average was higher for Gloria SA with an index of 0.068, compared to the defensive test index of 0.030 obtained by Laive SA.
According to the opinion in 2017 presented by Gloria SA on the Lima Stock Exchange website, it explains that cash and cash equivalents (made up of cash and banks), was the highest level compared to the others results since it can only cover 10% of short-term liabilities, which were mainly collections of checks pending on deposit (S / 1´647,000) that entered cash and (S / 74´687,000) in current accounts both in soles and dollars without accruing interest. The lowest level in recent periods was in 2018, only being able to cover current financial obligations by 5%, with deposits established with financial entities in the national market, generating interest of an annual average of 3%, for a total of (S / 46'977,000).
On the other hand, reflected in the opinions of Laive SA of the year 2018 being the one with the highest level of defensive liquidity, it achieved a cash and bank coverage of 8% of current liabilities, being the current accounts of which 99% of the cash, equivalent to (S/ 10'715,000). The lowest year was in 2019 with a coverage of 0%, where in the documents it was explained that this is because the money was used to purchase raw materials and supplies in greater quantity than in previous years due to the increase in the product demand.
CONCLUSION
It was concluded that the study managed to analyze the financial situation of accounts receivable and liquidity through ratios of the only 2 companies in the dairy sector that are listed on the Lima Stock Exchange. The company Leche Gloria SA had a greater capacity to carry out collections with an average of 12 times per year in the last 5 years, due to the management of collection policies and the issuance of guarantees by clients to reduce credit risk. In the case of Laive SA, it had a turnover of collections 9 times a year, being the one with the lowest capacity in the dairy sector, due to the deterioration of bills with 180 days due, equivalent to 20% of accounts receivable.
The first specific objective regarding accounts receivable was concluded that Gloria SA company presented a better sufficiency to carry out collections, due to a better control of credit policies because it had less time to the collection of what is required of its clients, with an average of 30 days in the last 5 years. While Laive SA had an average of 38 days to collect which the company tried to evaluate the loans granted twice a year according to credit behavior, even using the guarantees deposited by customers.
It was determined according to the second specific objective regarding the analysis of liquidity through financial ratios, that Gloria SA company had better payment capacity to meet its short-term obligations exceeding the estimated range (greater than 1), which has an average of 1.62, while Laive SA obtained a lower average of 1.28 due to purchases of raw materials, supplies and finished products for sale.
Also, Gloria SA company presented an average of 0.80 in the Acid-Test, because the inventory equivalent to 47% was excluded, so it continued to have liquid resources to meet its financial obligations. Likewise, Laive SA company had an index of 0.52 except for 54% of the inventory during the periods analyzed, this being the one with the least capacity to pay the debts. Finally, it was determined that Laive SA had less effective capacity in the short term, which obtained an average of 0.03 because money was used for the purchases of raw materials and supplies in greater quantity, however Gloria SA had an average of 0.07, covering only 10% of current liabilities, with the collection of checks and deposits in financial entities.
The limitations were the obtaining of more specific and meticulous information regarding the composition of the balances of accounts receivable and sales, due to the Covid-19 Pandemic, and only the extensive information consolidated and presented in the Stock Exchange was used. de Valores de Lima del Perú.
The contributions of this study are the following:
REFERENCES
Please refer to articles in Spanish Bibliography.
BIBLIOGRAPHICAL ABSTRACT
Please refer to articles Spanish Biographical abstract.