
Figure No1: Six Sigma DMAIC Sequence
Source: ISO 13053: 2011
Stability assessment and process capability analysis in a food pasta company
(*)Roxana González Álvarez; (**)Aníbal Barrera García; (***)Ana Beatriz Guerra Morffi; (****)Juan Felipe Medina Mendieta
(*)Faculty of Engineering. University of Cienfuegos
Cienfuegos, Cienfuegos Province, Cuba
rgonzalez@ucf.edu.cu
(**)Faculty of Engineering. University of Cienfuegos
Cienfuegos, Cienfuegos Province, Cuba
abarrera@ucf.edu.cu
(***)CIMEX Sucursal Cienfuegos,
Cienfuegos Province, Cuba
abgmorffi@gmail.com
(****)Faculty of Economics and Business. University of Cienfuegos
Cienfuegos, Cienfuegos Province, Cuba
jfelipemm@ucf.edu.cu
Reception date: 04/29/2021 - Approval date: 05/13/2021
DOI: https://doi.org/10.36995/j.visiondefuturo.2021.26.01.006.en
ABSTRACT
Statistical quality control is a set of tools and techniques that allows to verify, monitor and control the variability of processes to improve product quality and business competitiveness. The objective of this study was to evaluate the pasta production process of a company that belongs to the food industry sector in terms of stability and compliance of quality specifications.
The Six Sigma improvement methodology was used, which focuses on identifying and eliminating the causes of variation in the processes. Data collection was accomplished by the use of different techniques, such as: interviews, brainstorming, review of documents, teamwork and direct observation. In addition, process documentation techniques and classical quality tools including Pareto chart, control charts, process capability analysis, histogram, Ishikawa diagram and experimental design were used. Multivariate data reduction techniques were also applied.
The results showed for the quality characteristic Humidity that the process is out of statistical control and it is uncapable to meet the required specifications, for which the causes were investigated and improvement actions were proposed, achieving an increase in the sigma quality level.
KEY WORDS: Pasta; Quality Control; Control Charts; Process Capability Analysis; Six Sigma.
INTRODUCTION
Pasta is a food with high worldwide acceptability, versatile, inexpensive, easy to prepare and store (Ramírez, 2015). It has nutritional and sensory value (Biernacka et al., 2017), a low glycemic index effect (Makhlouf et al., 2019), low in sodium and fat, without cholesterol and rich in complex carbohydrates (Garsa, 2017). It can be combined with a wide variety of sauces and flavorings (Murray, Kiszonas and Morris, 2017).
It is obtained by mixing water with wheat semolina or wheat flour, or mixtures of them subjected to the processes of kneading, pressing, molding and drying (NC 935: 2012). Food enrichments or additives can be added to increase its nutritional value (NC 935: 2012; Bustos, Pérez and León, 2015).
The quality of the pasta is evaluated by conducting tests based on the determination of physico-chemical (acidity, humidity) and cooking properties (Carrasquero, 2009; Biernacka et al. 2018; Peña, 2019), as well as the nutritional and sensory evaluation (texture, flavor, color, aroma) (Larrosa et al., 2016; Bouasla, Wójtowicz and Zidoune, 2017; Biernacka et al., 2017).
In the case of physico-chemical characteristics, compliance with quality specifications contributes to reduce microbiological risks and maintaine the desired sensory properties (Carrasquero, 2009; Ramírez, 2015; Peña, 2019). Moreover, in the sensory analysis, authors such as Biernacka, Dziki, Gawlik-Dziki, Różyło and Siastała (2017) explain that the reference parameters are strongly affected by the market, which limits the conduct of studies with a scientific approach. Both the color of the pasta and the texture constitute quality characteristics that depend to a large degree on the properties of the composition of the raw material (Biernacka et al., 2017).
It should be noted that the best quality pasta is made from durum wheat semolina, which is trade at a higher price than common wheat; that is why pasta is often produced from the latter (Fuad and Prabhasankar, 2010). The product obtained from that flour is generally characterized by a poorer cooking quality (Biernacka et al., 2017), so adequate processing and balanced formulations are required to counteract its poor technological properties (Fuad and Prabhasankar, 2010).
Fuad and Prabhasankar (2010) and Biernacka, Dziki, Gawlik-Dziki, Różyło and Siastała (2017) indicate that to obtain very high quality pasta it is necessary to properly select the raw materials, ingredients and additives to be used, control the input variables of the production line and fulfill the established packaging requirements that guarantee the shelf life of the product.
For their part, Ogawa and Adachi (2017) state that the most complex stage of the pasta production process is drying. Some research has shown how the temperature and humidity conditions of the drying operation influence the pasta quality (Sicignano et al., 2015; Piwińska et al., 2016). Peña (2019) also emphasizes that correct drying gives pasta stability, strength, cohesion, better performance during cooking, less risk of microbiological growth and a long shelf life.
Quality monitoring and control in the food industry requires the application of statistical tools and techniques that allow verifying, monitoring and controlling the variability of its production processes to improve quality, competitiveness and business performance (Soriano, Oprime and Lizarelli , 2017).
Statistical quality control has been widely used in this sector (Rábago, Padilla and Rangel, 2014; Chero et al., 2019), constituting one of its key functions, since it is related to the verification of products to meet food standards and attract consumer confidence.
A study carried out by Abdul, Antony and Arshed, (2016) showed that the implementation of statistical quality control tools provides to the food industry the advantages to improve the performance of processes, such as quality and operation of the product. However, Soriano, Oprime and Lizarelli (2017) state that there is still a lack of reviews on quality management and improvement practices in this sector, especially in the application of statistical quality control.
Authors such as Idrissi and Benazzouz (2019) suggest that with the utilization of Six Sigma (SS), the use of data and statistical thinking have been promoted, a methodology that focuses on improving the level of performance and the capability of organizational processes through reduction of the variability.
Abdul, Antony, Arshed and Albliwi (2017) and Message, Godhino and Fredendall (2018) also state that the implementation of activities or programs related to quality such as SS guarantees that food preparation is safe and of quality and that this methodology is effective for the food sector, whose implementation is still growing.
In the specific case of Cuba, companies in the food industry require to place emphasis on quality improving of their products and business performance, which allows them to survive in an increasingly competitive environment. In this sense, compliance with established food standards and production processes control to guarantee the quality and innocuity of food, constitute problems of current and strategic importance.
Along with the above, there are lacks in the daily business practice in this sector in Cuba, in terms of the use of statistical techniques and tools that allow control production processes, which affects the final product quality.
The present research was carried out in a food pasta production company that distributes its products in the country's retail network, social consumption centers (hospitals, schools) and tourist institutions. During the first four months of 2019, losses due to poor quality were identified that are in the order of 66,60 tons, equivalent to 95 160 Cuban pesos.
The organization has among its priorities, promoting the use of statistical tools and techniques that allow quality control of its productions with a focus on continuous improvement. The objective of this work is to evaluate the stability and capability of the pasta production process. With the execution of the present work, the main problems related to instability and the low capability of the process to meet specifications are determined, as well as the proposal of improvement actions, which are visualized in an increase in the sigma quality level.
DEVELOPMENT
Materials and methods
The procedure used for the development of the research is the Six Sigma methodology (See Figure No1). This is methodologically organized in five phases.
Figure No1: Six Sigma DMAIC Sequence
Source: ISO 13053: 2011
These phases are explained below based on what was stated by García (2014):
Phase I: Define
It consists of making a diagnosis of the current situation of the company, identifying which are the elements selected to apply the methodology. This can be based on its strategic objectives, performance of the processes and the deficient customer service aspects that respond to the requirements of the product and/or service.
Phase II: Measure
The critical characteristics that influence the variables resulting from the process must be determined and measured. A data collection plan should be prepared, for which it is important to ensure the reliability of the measurement devices that can be measurement instruments or evaluation questionnaires for the service.
Phase III: Analyze
It consists of analyzing the data obtained from the measurement phase, identifying the sources of variability. In it, the existing relationships between the input and output variables of the process are deduced. This phase is the one with the greatest technical content since the theories or hypotheses about the operation of the process are checked, where it is necessary to resort to advanced statistical tools. The outputs of this phase include the analysis of the influence of these variables, process capability, identification of the sources of variability and preparation of the improvement phase from the root causes.
Phase IV: Improve
It begins when vital causes have already been identified. An improvement implementation plan is developed that provides solid solutions to eliminate the defects that the process incurs and a cost-benefit analysis of the solutions is carried out, so that they can be of help to the decision-making of the management of the company. Generally, before the improvements are implemented, it is advisable to make a pilot test of them to determine their scope.
Phase V: Control
The validity of the solutions proposed and tested on a pilot scale is checked. Controls must be established, not only on the outputs of the process but also on the vital causes that affect its achievement. Sometimes the processes, after a while lose regularity in their behavior, so to avoid this, the Six Sigma methodology imposes controls that permanently monitor the processes in order to maintain the gains achieved.
Results
For the application, a long pasta production company, belonging to the food industry sector, was taken as the object of study.
Phase I: Define
The company under study produces three types of long dry pastas (Spaghetti). The differences between these lie in the composition and the type of raw material to be used. Based on the classification established in NC 935: 2012, dry pastas are classified into six quality grades. Those described below correspond to the productions of the company under study:
During the period from January to April 2019, the selected food pasta company produced a total of 2 308,37 tons. Of these, 1769,91 tons correspond to the spaghetti Grade B of 400 grams, which represents 76,67% of the total, as shown in the Pareto chart of Figure No2.
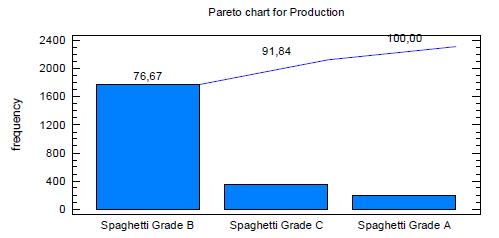
Figure No2: Pareto chart for Production (Ton) in the period of January - April 2019
Source: Self Made
In the same period, 66,60 tons of losses associated with the poor quality of the pastas were identified, equivalent to 95 160 Cuban pesos. Figure No3 shows the losses by type of product, where spaghetti Grade B represents 84,94% of the total.
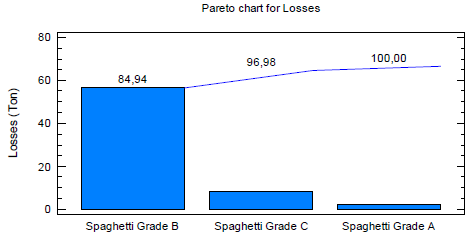
Figure No3: Pareto chart for Losses (Ton) in the period of January - April 2019
Source: Self Made
From the exposed situation, it becomes evident the need to apply statistical quality control tools to know the current state of the pasta production process in terms of stability and capability to meet specifications.
The quality characteristics for which a batch is accepted as well as its specifications are established in the Food Industry Branch Standard NRIAL 168: 2001 Dried Pasta - Specifications.
It is important to note that the specialists consider that the main problem associated with losses due to poor quality pastas is due to non-compliance with the physico-chemical characteristics. Table No1 shows these characteristics.
Table No1: Physico-chemical quality characteristics for dry pasta Grade B
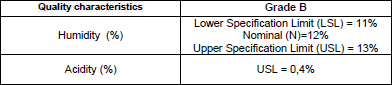
Source: NRIAL 168: 2001
A high content of humidity (>13%) increases the risk of microbiological alterations of the product, since it becomes more prone to decomposition and as a consequence, toxic infections appear, in addition to losing the desired sensory characteristics. Meanwhile, a very low humidity (<11%), in addition to altering the pasta cooking process, implies a high increase in costs for the company and a decrease in performance.
The acidity also guarantees the innocuity of the pasta, preventing diseases. Values of 0,4% or less, allow to obtaining a safe product ready for human consumption.
At this phase, the pasta production process was also documented through a SIPOC diagram (suppliers-inputs-process-outputs-customers), a basic flowchart and the corresponding process sheet, useful tools to understand and describe it.
Phase II: Measure
Process stability assessment
To evaluate the stability, control charts were used, in this particular case the chart of averages was selected to control the central tendency of the process and the chart of ranges to control the variability. To this end, eight daily observations of humidity and acidity were taken during 24 days of the month of April 2019.
These charts were selected since they apply to continuous quality characteristics such as humidity and acidity. The size of the subgroup was considered as the total number of observations that were made daily, being 8. This type of analysis allows identifying if the process is working with common or assignable causes of variation.
Figures No2 and No3 show the average and range charts for humidity (%) respectively corresponding to the month of April 2019.
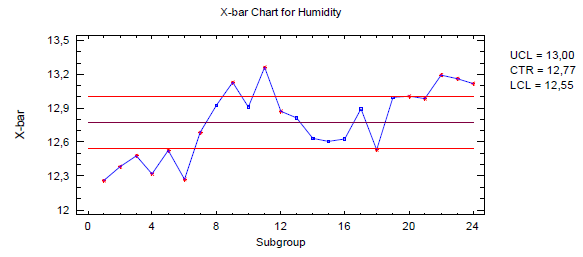
Figure No2: Average control chart for the quality characteristic Humidity (%) in the month of April 2019
Source: Self Made
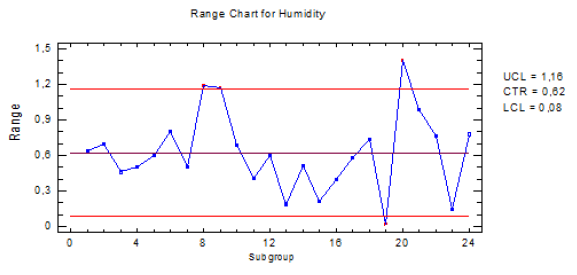
Figure No3: Range control chart for the quality characteristic Humidity (%) in the month of April 2019
Source: Self Made
For this quality characteristic, the process is working with assignable causes of variation since some of the plotted points are beyond the control limits and non-random behaviors are observed. The runs tests look for and identify any unusual patterns in the data. Table No2 shows the subgroup at which the unusual pattern was detected, as well as the particular rule which was violated.
A total of 23 unusual sequences were detected in the average chart and one in the range chart.
Table No2: Runs Tests for the quality characteristic Humidity (%)
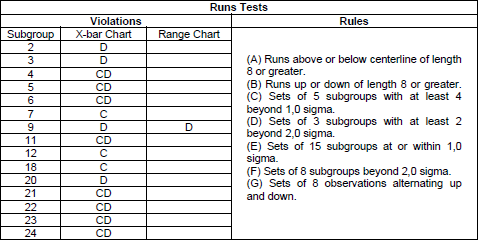
Source: Self Made
In the case of the chart of averages, displacements or changes in the average level of the process are observed, which indicates in this case that the process has worsened. This occurs when one or more plotted points are beyond the control limits or when there is a long and clear tendency of successive points on only one side of the centerline.
A very unstable process is a process with poor standardization, where there are continuous changes or a lot of variation attributable to materials, measurements, differences in the operating conditions of the machinery and disarrangements, different criteria and lack of operator trainings, among others.
Figures No4 and No5 show the average and range charts for acidity (%) respectively.
For this quality characteristic, it is observed that the process is working with common causes of variation, since none of the plotted points are beyond the control limits and fluctuate or vary randomly across the chart. It can be said that the process is in a state of statistical control, that is, its behavior is predictable in the immediate future.
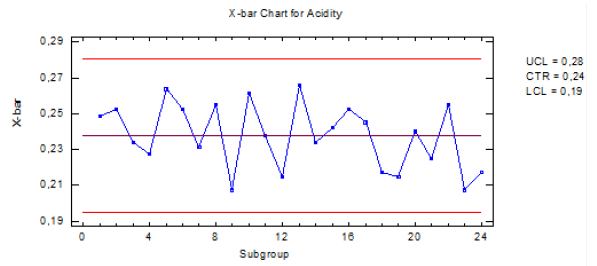
Figure No4: Average control chart for the quality characteristic Acidity (%) in the month of April 2019
Source: Self Made
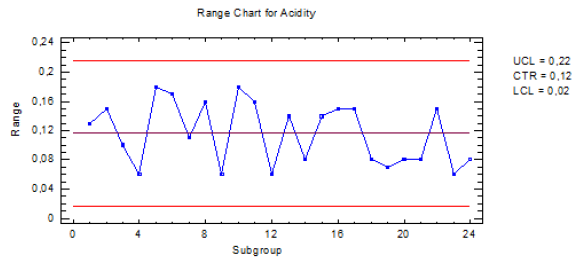
Figure No5: Range control chart for the quality characteristic Acidity (%) in the month of April 2019
Source: Self Made
Process capability analysis
The assessment of the process capability, that is to say, of the process ability to meet the quality specifications, is evaluated from the capability indices for continuous variables.
In this case, there is a variable of the type “nominal value is better”, where to consider that there is quality, the measurements must be equal to a certain nominal or ideal value (N=12%), or at least they must be within the lower (LSL=11%) and upper (USL=13%) specification limits. What is intended is to analyze whether the process is capable of meeting these specifications.
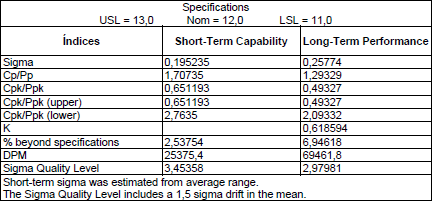
Figure No6 shows the process capability graph for humidity and Table No2 the estimated short-term capability indices and long-term performance indices.
The short-term capability represents the potential of the process, that is, the best that can be expected from it. It is evident that the process is potentially capable of meeting specifications if it were centered (Class 1: Adequate for the job) since the value of Cp=1,55 is greater than 1,33 according to what Gutiérrez and De la Vara (2013) establish.
The analysis of the one-sided indices allows concluding that the process is capable of meeting with the LSL since the Cpk (lower) index is greater than 1,25, while the Cpk (upper) indicates that the process is not capable of meeting the USL according to the criteria of Gutiérrez and De la Vara (2013). In addition, according to the K index, the process is decentrated to the right of the nominal value by 77%, which influences its low capability.
The analysis performed with the indices is corroborated by comparing the real process limits with the specification limits on the capability graph. According to these analyzes and to the results obtained, 14,58% of the batches do not meet the USL, equivalent to 145 827 for every million produced.
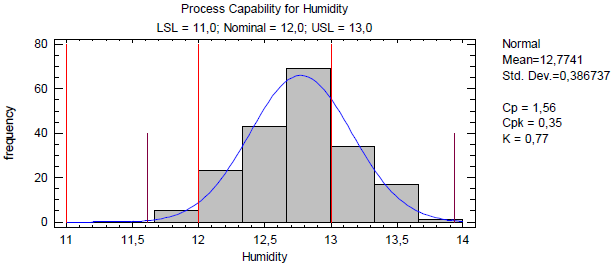
Figure No 6: Process capability graph for the Humidity in the month of April 2019
Source: Self Made
Table No2: Capability indices for the Humidity in the month of April 2019
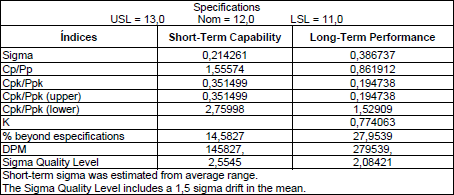
Source: Self Made
For their part, the Pp and Ppk indices are focused on the long-term performance of the process and not only on its capability. In this case, the potential performance index, Pp=0,86, indicates a potentially not adequate process; likewise, the real performance index Ppk=0,19 reveals a process with poor performance mainly due to its off-centering. The rather large difference between Pp and Ppk is a sign that the distribution is not well centered between the specification limits.
The sigma quality level, a metric used to quantify the quality level of the processes, allows to conclude that for humidity in the short term it is 2,55 and in the long term it is 2,08, values that are considered not adequate given that are less than 4.
For acidity, there is a variable of the type “the smaller is better”, where what is important is that the values are lower than a certain maximum value or USL, which in this case is 0,4%.
Figure No7 shows that the process is capable of meeting the USL, which is corroborated with the value of the real process capability index, which is greater than 1,25, which is considered adequate according to Gutiérrez and De la Vara (2013) for processes with only one specification.
The batches that do not meet this specification are in the order of 71,84 for every million produced, which is equivalent to a sigma quality level of 3,8 close to 4, as shown in Table No3.
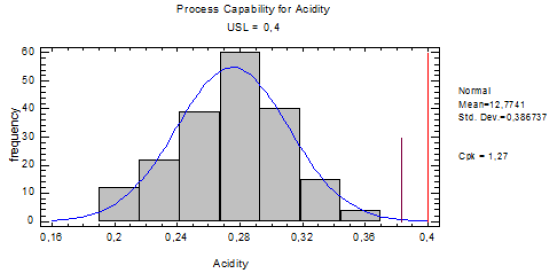
Figure No7: Process capability graph for the Acidity in the month of April 2019
Source: Self Made
Table No3: Capability indices for the Acidity in the month of April 2019
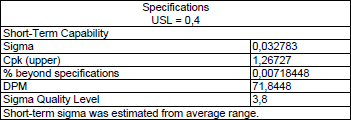
Source: Self Made
Normality analysis
For these results to be valid it is required that the quality characteristic fits the Normal distribution. The non-parametric Chi-Square test is performed, the results of which are shown in Table No4 and Table No5 for humidity and acidity respectively.
Since the P-value is greater than 0,05, the idea that both characteristics come from a Normal distribution with 95% confidence cannot be rejected.
Table No 4: Goodness-of-fit test for the Humidity. Chi-Square test
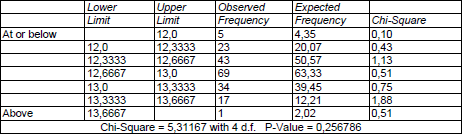
Source: Self Made
Table No5: Goodness-of-fit test for the Acidity. Chi-Square test
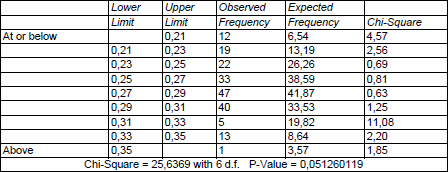
Source: Self Made
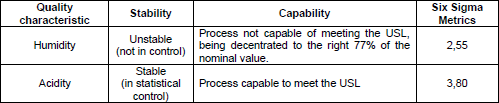
Table No6 shows a resume of analyzes performed.
It is evident that the long pasta production process for the quality characteristic Humidity is unstable and uncapable to meet specifications; while for Acidity it is considered a process in statistical control and capable.
Table No6: Resume of the process state
Source: Self Made
Phase III: Analyze
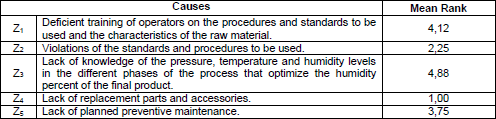
To investigate the possible causes that affect the low stability and capability of the process in terms of humidity, the cause-effect diagram was used. It was built in a brainstorming session based on the accumulated experience of the workpeople who labor in the process. The causes were grouped into three categories: labor, technology and methods.
To identify the most probable causes, an expert method was performed with a scale from 1 to 5, where 5 represents the most important cause and 1 the least important one. A total of eight experts participated. The statement of the hypothesis is:
H0: There is no consensus among experts
H1: There is consensus among experts
The contrast statistics of the non-parametric test carried out show that the asymptotic significance is 0,000, a value less than 0,05 (level of statistical significance), so H0 is rejected, which means that there is consensus among the experts with a Kendall's Coefficient of Concordance W of 0,977. Table No7 shows the mean rank for each of the causes analyzed, the most critical being Z3, Z1 and Z5.
Table No7: Expert method
Source: Self Made
Phase IV: Improve
The improvement phase was focused on giving a solution to the main root cause (Z3), for which the corresponding improvement plan was designed. The proposal is based on determining the appropriate values of the process control variables (Pressure, temperature and humidity) that allow improving the stability and capability for the quality characteristic under analysis.
Twenty six process control variables (X's) and a response variable corresponding to the humidity of the final product (Y) were taken into account. The study begins with an analysis of the descriptive statistics of the variables to be studied in order to eliminate erroneous data. A total sample of 267 data was obtained corresponding to the months of May to July 2019. For each variable, low mean errors and coefficients of variation that do not exceed 15% ware identified. The variable X7 maintains the same value for each case, so it is not taken into account, since it does not provide important information in the analysis.
Multivariate data reduction techniques (Factorial analysis) were used, due to the large number of variables that could be affecting the humidity of the final product. The principal components technique was applied in order to represent the 25 original variables in new variables (principal components) expressed as a linear combination of the original ones. The criterion of eigenvalues over 1 was used for the retention of principal components and an orthogonal rotation Varimax was applied.
A total of seven principal components were retained, that explain the 68% of the total variance of the data, which is adequate. The Bartlett’s test of sphericity with an asymptotic significance lower than 0,05 indicates that exist relationship among the independent variables and the Kaiser-Meyer-Olkin measure of sampling adequacy presents a KMO>0,5, therefore there is adequacy of the data to a factor analysis.
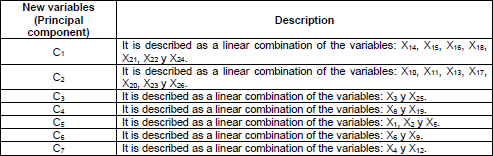
Each component or new variable will be made up of the linear combinations of the original variables shown in Table No8.
Thus, in the new model, the response variable was valued based on the seven principal components.
Table No8: Principal components
Source: Self Made
In order to determine the optimal values of these variables, a response surface model corresponding to a factorial experimental design 27 was applied. It is shown that the variables or their interactions: C3 * C7, C2 * C3 and C6 have a statistically significant influence on the response variable.
An optimization of the model for an ideal value of final product humidity of 12% provides the optimal values of the main components. Using the response surface models to optimize each of the original variables from each principal component variable, the optimal values are obtained, which are shown in Table No9.
Table No9: Optimal values for the original variables
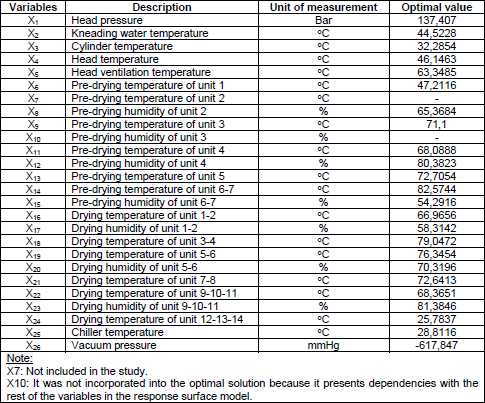
Source: Self Made
Aimed at reviewing the proposed actions, a control plan was designed, according to a previous analysis in a work session among the team members.
Phase V: Control
After implementation of the improvement actions, it is necessary to verify their effectiveness through stability analysis and the evaluation of the ability of the process to meet specifications. To carry out the monitoring, the average and range charts and the capability indices for variables with double specification were used again. The data correspond to the month of September 2019.
It is observed in both control charts (See Figure No8 and Figure No9) that there are no trends, or any other special pattern, or points beyond control limits.
Therefore, the process has been running in a stable manner and is under statistical control.
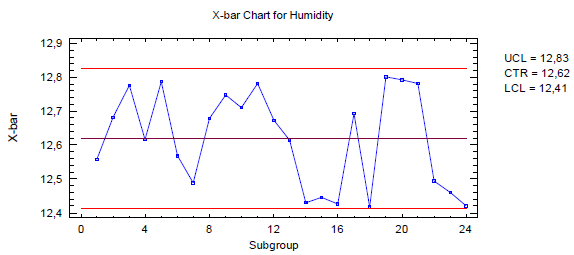
Figure No8: Average chart for the quality characteristic Humidity (%) in the month of September 2019
Source: Self Made
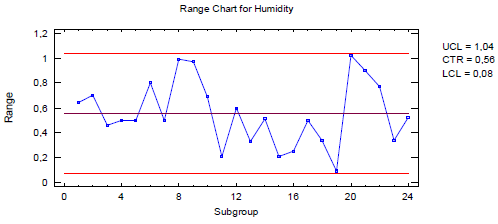
Figure No9: Range chart for the quality characteristic Humidity (%) in the month of September 2019
Source: Self Made
The capability graph is shown in Figure No10 and the estimated values of the capability indices in Table No10.
The process continues to be potentially capable of meeting specifications with a value of Cp=1,71, adequate for the work according to Gutiérrez and De la Vara (2013).
It is evident that the centering of the process improved, being average 61,8% to the right of the nominal value according to the K index, with an improvement of 16% in relation to the initial state. The above indicates that the off-centering of the process still influences its low capability, although to a lesser extent. The real process capability index (Cpk) with a value of 0,65 and which coincides with the upper one-sided index (Cpk upper) shows an increase, although still insufficient to consider it adequate. In this way, 2,53% of the batches contain humidity higher than 13%, a value lower than that obtained at the initial study, which was 14,58%. The process continues to be capable to meet the LSL as the Cpk (lower) index is equal to 2,76.
Both the potential performance index Pp and the real performance index Ppk experienced increases, which reveals an improvement in the performance of the process. The number of short-term sigmas also improved from 2,55 to 3,45, as well as the long-term quality level, whose value varied from 2,08 to 2,97. However, they continue to be below 4.
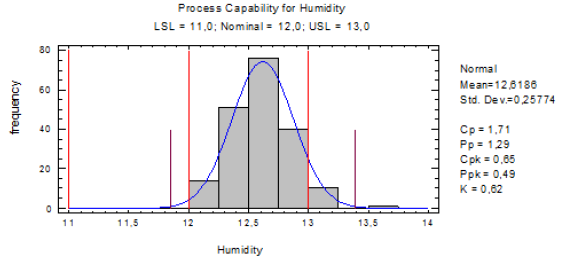
Figure No10: Process capability graph for the Humidity in the month of September 2019
Source: Self Made
Table No10: Capability indices for the Humidity in the month of September 2019
Source: Self Made
The comparison of the state of the process before and after the improvement as shown in Table No11 evidences that the process goes from Type D (Unstable - Incapable) to Type C (Stable and Incapable) following the criteria of Gutiérrez and De la Vara (2013).
Although the process continues to be classified as uncapable to meet specifications, an improvement is achieved that is manifested in the sigma quality level and the percent beyond specifications.
Table No11: Resume of the process state before and after improvement
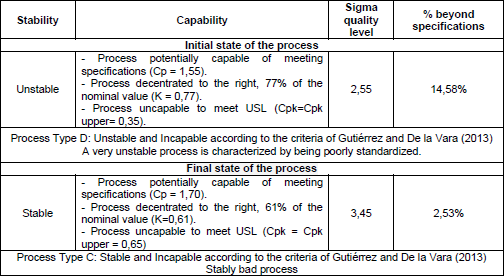
Source: Self Made
The normal probability plot shown in Figure No11 evidences the fulfillment of the assumption of normality of the data, since the points are close to the straight line.
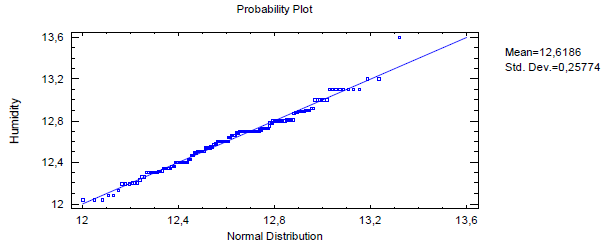
Figure No11: Normal probability plot for Humidity in September 2019
Source: Self Made
CONCLUSIONS
REFERENCES
Please refer to articles in Spanish Bibliography.
BIBLIOGRAPHICAL ABSTRACT
Please refer to articles Spanish Biographical abstract.