Maintenance planning

Note. Own elaboration with the data provided by the entity.
Quantitative tools for maintenance planning for in-situ service entities
(*)Ernesto Rodríguez González; (**)Rosario Garza Rios; (***)Caridad González Sánchez
(*)Facultad de Ingeniería. Universidad Panamericana
Ciudad de México, México.
erodrigo@up.edu.mx
(**)Universidad Tecnológica de la Habana José Antonio Echeverría (CUJAE)
La Habana, Cuba.
rosariog@ind.cujae.edu.cu
(***)Universidad Tecnológica de la Habana José Antonio Echeverría (CUJAE)
La Habana, Cuba.
caryg@isb.cujae.edu.cu
Reception date: 10/01/2021 – Approval date: 02/01/2022
DOI: https://doi.org/10.36995/j.visiondefuturo.2023.27.01.004.en
ABSTRACT
The company under study is dedicated to providing in-situ maintenance services, its objective is to provide comprehensive security technical goods and services to national and foreign entities, according to current standards; with professionalism and advanced technologies, guaranteeing the primacy in the national market and promoting exports. These services involve moving employees and equipment to the physical locations of customers.
The companies that are dedicated to guaranteeing Security Systems, need to always keep the equipment installed available to the clients, so it is essential for them to periodically restore the capacities of these systems.
The objective of this work is to propose the use of a set of quantitative tools that allow to increase the efficiency and effectiveness in the planning of on-site maintenance services.
The security and protection company under study for the application of the proposal, improved considerably in terms of availability of the systems installed to customers and in the use of the resources.
The work includes tools for the planning phases: long-term, which will be carried out annually, short-term, to decide on a monthly basis which clients will be served and the daily one in which it is determined on a daily basis which clients will be served.
KEY WORDS: In-situ service; Maintenance; Security systems; Planning; Linear Programming; Routing.
INTRODUCTION
Companies dedicated to the installation and maintenance of security systems are becoming increasingly important, both worldwide and for Cuba, due to the risks that may occur due to failures in these systems. This makes company’s worry about having the necessary technology to provide more security in their entities, and thus avoid exposing themselves to unnecessary dangers. Risks for companies have increased in today's world, new forms of crime, fire risks, high voltage and weather conditions. These dangers can be combated with good, efficient and reliable security systems.
In these services, restoring the capabilities of the technology periodically plays an essential role, which is why it is vital to carry out preventive maintenance, which guarantees the proper functioning of the systems. Correct maintenance planning will be an essential requirement to guarantee the extension of the useful life of the technology, in addition to this it is necessary to optimize resources and improve the performance of the organization.
The problem of maintenance has been a widely discussed topic in the bibliography consulted (Cao et al., 2018; George y Patelli, 2017; Viveros et al., 2013; Enriques et al., 2019; Pagani et al., 2019; Rob et al, 2019), among others. In the opinion of the authors, the management of maintenance in organizations that provide service based on site, has been little treated, which represents the problem to be solved in this work.
To approach this problem with a new paradigm of application of mathematical tools for decision making, constitutes a contribution of this work. It presents a procedure for the management of the preventive maintenance service in a security and protection entity that provides on-site service, which avoids repeated visits to the same client, as a result of the application of mathematical and statistical techniques.
The work consists of three sections: the first presents a bibliographical analysis of the maintenance activity that supports the need to develop the work. The second includes a description of the entity under study and the third shows the quantitative tools used.
Materials and methods
This section presents the bibliographic analysis that theoretically bases the development of the work as well as the description of the entity under study and the methods and techniques used.
1. Bibliographic analysis
Maintenance has been evolving in its concepts and methods since the 40s of the last century, gaining more interest today. There have been various publications where you can find topics of interest related to this activity, its definition, approaches and tools to use (Khatab et al., 2018; Kalinowski et al., 2019 and Ardila et al., 2016).
Among the studies carried out by several authors are:
• to carry out a diagnosis (Martinez et al., 2019),
• to determinate of reliability operational (Fornes et al., 2016; Diaz et al., 2018),
• to optimizate of maintenance in wind power generators (Salgado et al., 2018)
Other authors such as (Xiao et al., 2010 and Duran, 2011) suggest the need to use expert techniques, surveys, customer opinion to collect and then process the information using different statistical techniques, fuzzy logic models or the AHP method. (Analytic Hierarchy Process - AHP)) to obtain the hierarchy of problems.
The integration of control charts to maintenance management with the design of a mathematical model to analyze the hourly cost of maintenance is addressed by (Zhou and Zhu, 2008).
Some of the decision-making methods and tools (Falatoonitoosi et al., 2013) use the AHP as part of a hybrid multi-criteria model to obtain the final decision of a complex maintenance planning problem (Zhou and Zhu, 2008). , many of these methods and tools have served as the basis for developing various maintenance management models.
Viveros et al (2013) make a proposal for a model for maintenance management and the use of support tools and in (Herrera and Duany, 2016) a methodology for the design of a maintenance program is shown.
Despite the wide range of studies carried out on maintenance management, there are problems that have not been fully addressed, such as the one addressed in this paper.
Below is a description of the entity under study where the situation expressed above is evidenced.
2. Description of the entity under study
The security and protection company under study is one of the 44 companies of this type that our country has. It is dedicated to providing "turnkey" Comprehensive Security Systems services, carrying out the work: projection, supplies, installation, start-up, customer training and after-sales service. This comprehensive system is made up of different subsystems that, interrelated, ensure the appropriate level of protection. The technologies that make up the comprehensive system provided by the company are shown below.
1. Automatic fire arrest system (SADI)
2. Fixed extinguishing system
3. Portable extinguishing system
4. Protection systems against Atmospheric Discharges
1. Intrusion Alarm System (SACI)
2. Access and circulation control system (C/A)
3. Closed circuit television system (CCTV)
1. Protection against atmospheric discharges.
2. Physical Earth
3. Transient suppressors
4. Structured cabling
In this context, the company is in a privileged position within the security sector, because it provides full-cycle insurance services (turnkey), professionals with more than 10 years of experience in the sector work and projects are executed of high complexity abroad with an organizational infrastructure that covers the entire country.
In recent years there have been problems with compliance with maintenance plans. Figure 1 is showed the behavior for the year 2019; on the abscissas are the months and on the ordinates the volume of clients to visit in each month to provide maintenance.
Figure 1
Maintenance planning
Note. Own elaboration with the data provided by the entity.
Figure 1 shows that the volumes of customers to visit for maintenance with respect to the plan from one month to another are unequal, which shows poor planning methods, this motivated an analysis of the causes, detecting that the main They are: organizational and human techniques, with organizational techniques being the ones that most influence the results obtained, representing 36% of the total.
The maintenance planning is carried out for each system independently, considering the cycle established for the different security systems installed, as shown in Table 1.
The maintenance times declared in the contracts with the clients are also taken into account according to its category, this is shown in Table 2.
Table 1
Maintenance cycle

Note. Own elaboration with data from the entity.
Table 2
Contracted maintenance times
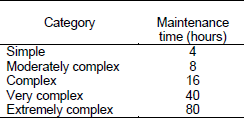
Note. Own elaboration with data from the entity.
The lack of integration in maintenance planning has caused non-compliance, obtaining an average compliance of 38.4%, 59.3% and 73.4% in recent years (Garza et al., 2019).
An analysis of the customer satisfaction survey showed that only 67.5% consider that the company always complies with the established maintenance frequency, evidencing a high degree of customer dissatisfaction. While 68% consider that the service is regular.
The analysis of the problems presented and the literature consulted allowed us to reach the conclusion that it is necessary to design a procedure that, based on quantitative methods, allows planning the maintenance service in entities that provide on-site service.
Below is a description of the work procedure used by the authors to obtain the maintenance plan with a quantitative approach, which includes materials and methods used.
3. Quantitative tools to obtain the maintenance plan
The work procedure proposed by the authors has five phases, in each of which the use of quantitative techniques for decision-making, statistical and management tools is proposed.
Table 3 shows each of the phases that make up the procedure, the activities involved in each one and the objective pursued.
The phases range from the detailed diagnosis of the service to the analysis of effectiveness and improvement, and an assessment of the results obtained is made with a view to continuous improvement.
Table 3
Procedure phases

Note. Own elaboration.
The work focuses its attention on a set of activities that, in the opinion of the authors, are the most appropriate for the inclusion of quantitative tools due to their complexity and importance, which are:
Phase II: Planning and organization of the maintenance service
Phase III: Preparation of the monthly maintenance plan
Phase IV: Preparation of the maintenance operational plan
Phase V: Analysis of effectiveness and improvement
Below is a brief overview of each of these activities.
Phase II: Planning and organization of the maintenance service
When implementing a maintenance service, the actual times of said activity are not known a priori, these are subject to variations depending on the characteristics of the client and the operators who carry out the maintenance.
To estimate the times of the preventive maintenance service, it is proposed to use the regression technique (Martinez et al., 2018) for which the following steps must be executed:
1. Selection of the dependent and independent variable.
2. Data collection
3. Data processing
4. Study the inference of regression
5. Analyze the equation found to estimate the times.
The objective of a simple regression study is to find a mathematical model that characterizes the relationship between two variables and that allows estimations of one as a function of the other. This implies that it will be necessary to differentiate between the independent variable X and the dependent variable or response Y.
Once the dependent variable and the independent variables have been defined, the data relevant to each of them must be collected and processed. To process them, any statistical package that speeds up the process of obtaining the final equation can be used.
The maintenance service times for each system show that they do not all take the same time. This occurs because they not only depend on the nature of the maintenance, but also on the comprehensive classification of the client, taking longer those with the highest score (Garza et al., 2019).
The dependent variable selected for this work is the maintenance time and as an independent variable the client's score in each of the technologies, which includes: height at which the technology is located, obstruction and complexity of the equipment, environmental conditions, number of equipment to be maintained, number of devices, among others.
To obtain the regression equation, a total of 60 clients were evaluated, the time invested in each one was sampled in situ, taking into account their classification.
Two regression equations are obtained based on the score that the client receives for the electronic security and portable extinguishing systems, which are shown below:
Electronic Security Systems:
TMSE = - 637,6 + 1313 pun SE – 648,3 pun SE2 + 114,9 pun SE3
Portable Extinguishing System:
TMEP = 38,07 – 72,20 pun EP + 261,0 pun EP2 – 119,3 pun EP3
Where:
pun SE: score obtained in SE
pun EP: score obtained in EP
In the equations obtained, 96.7% and 94.5% of the errors are eliminated. Although certain rates were high, it is necessary to collect more information to achieve better precision in comprehensive maintenance times.
In the case of electrical protection and fixed extinction technologies, no regression equations were performed, since the maintenance times of all clients are known.
The use of a mathematical model of Linear Programming will allow balancing the maintenance workload. To propose a mathematical model of Linear Programming, it is necessary to define a set of decision variables, the objective function and the set of restrictions that limit the area of solutions. The decision variables used in this case are defined below. Table 4 shows the mathematical model that is proposed.
Where:
TA, TB, TC: Number of clients with classification A, B and C whose maintenance cycle is every six months.
Ta, Tb, Tc: Number of clients with classification A, B and C whose maintenance cycle is every three months.T1 = Ta +Tb + Tc
T2 = TA +TB + TC
Constraint 1 guarantees that the total number of clients visited in each work month will be balanced in terms of complexity, while constraint 2 not only considers complexity, but also the total number of clients that will be visited according to the maintenance cycle. Constraint 3 ensures that all customers are scheduled.
To obtain the solution of the mathematical model, you can use any of the software developed to solve Linear Programming problems, among which are: WinQSB, QmWin, SolverPro, Lips, you can even use the Excel Solver, or any other free software on the internet to solve the problem.
Table 4
Mathematical model to determine the number of customers
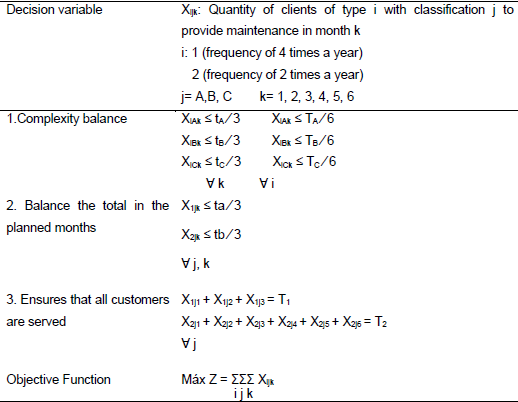
Note. Own elaboration.
For the solution of the mathematical model shown in table 4, the LiPs package was used, the mathematical model was applied to a sample of 60 clients for the first semester of 2019, obtaining the number of clients that can be maintained in each of the months of the semester, the results shown in Table 5.
Table 5
Number of clients that can be given maintenance in each month of the semester
![]()
Note. Own elaboration based on the results of the LiPs software.
In the selected sample there are no clients A who receive maintenance every 6 months, nor clients C who receive maintenance every 3 months. Due to this, type A clients are all distributed in the first quarter and are repeated for the second quarter. Clients C, like a part of clients B, are distributed among the 6 planning months. The results obtained are in agreement with the objective of the model. In all months the same number of clients is visited and the balance per month in terms of complexity is satisfied.
To determine which clients will be given maintenance in a month, an algorithm is designed that will allow them to be determined quickly and efficiently. The proposed algorithm consists of grouping the clients of the company that have maintenance frequency every three months and those that have it every six months. Figure 2 is a representation of the proposed algorithm.
Customers who have a maintenance frequency every three months are scheduled by quarter, and it is repeated in the four quarters of the year. In this way, it is possible to comply with what is stipulated in the contracts of the clients according to the installed system. Table 6 illustrates what was described above.
Table 6
Maintenance frequency
Note. Own elaboration.
Where:
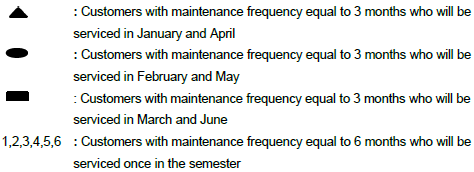
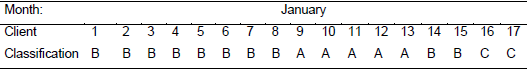
According to the algorithm designed to carry out this activity, the first thing that is done is to group the clients with the same maintenance frequency. It was determined that in the month of January it is necessary to give maintenance to 5 A, 8 B of every 3 months, 2 B of six months and 2 C (see table 7).
The application of the proposed algorithm allowed obtaining the clients to visit in each of the months of the first semester, the planning for the second semester is the same given the maintenance cycle defined according to the installed systems and the classification of the clients.
Figure 2
Algorithm for determining the monthly plan
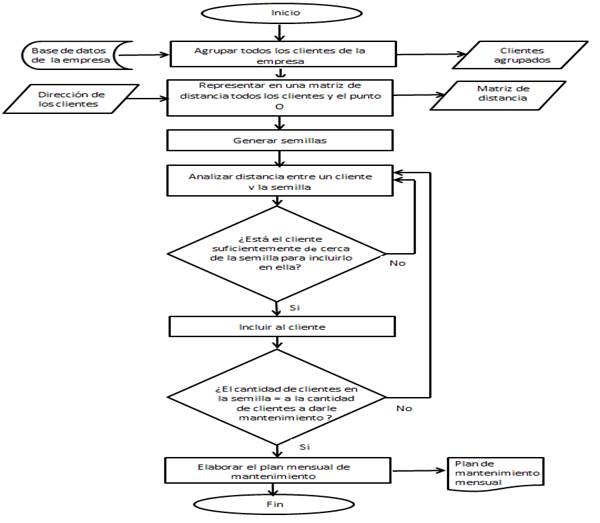
Note. Own elaboration.
Table 7 shows a summary of the number of clients that will be visited each of the first 6 months of 2019.
Table 7
Number of clients that must be visited to receive maintenance

Note. Own elaboration based on the results of the algorithm in Figure 2.
Table 8 shows the allocation for the month of January, similar tables are obtained for each of the months of the first semester of the year 2019.
Table 8
Customer visited in the month of January 2019
Note. Own elaboration.
Phase III: Preparation of the monthly maintenance plan
With the information obtained from the previous phase and the definition of the clients who will be given maintenance in a given month, the monthly maintenance plan is drawn up.
Table 9 shows an example of the plan for the month of January 2019.
Due to security problems, neither the client nor its address will be identified.
Table 9
Monthly Plan Summary

Note. Own elaboration.
LEGEND:
ID: Customer ID
C: Customer Name
CI: Comprehensive Customer Classification
TC: Technology owned and contracted
EF: Fixed extinction
SE: Electronic Security
PE: Electrical protection
EP: Portable Extinguishing
Phase IV: Preparation of the maintenance operational plan
The maintenance operational plan is made up of the routes or routes that the vehicles must carry out to transfer the specialists to the clients who will be given maintenance on the planned day, the use of a heuristic method based on the coefficient of distance saved is proposed. or saved ( Orrego et al., 2016; Maguiña, 2016; Prato et al. 2015, López and Vergara, 2017), which, although it does not provide the optimal solution, allows obtaining an efficient solution.
Expression 1 shows how the saved distance coefficient is determined:
Sij = doi + djo - dij (1)
Donde:
Sij: coefficient of distance saved or saved
doi: distance from point o to client i
djo : distance from client j to point o
dij: distance from customer i to customer j
The steps to obtain the routes to be carried out, and their description, are briefly explained below.
1. Creation of the generating nucleus of the route: for this, the travel time between the clients or the distance that separates them, the travel time from the exit point to each client and the monthly maintenance plan must be known. With this information, the distance or time saved is determined using expression 1, the generating nucleus is created with that pair of points that saves the greatest distance.
2. Verification of the time restriction: the restriction is verified through expression 2, using as data: maintenance time, travel time between clients and travel time from the exit point to each client. If the restriction is fulfilled, it begins with the conformation of the visit route to the clients and goes to step 3, if it is not fulfilled, it goes back to step 1.
3. Incorporation of a new client to the route: those points that save the greatest distance and can join the ends of the route in formation are analyzed, returning to step 2.
Tv(0,i)+Ts(i)+Tv(I,j)+Ts(j)+Tv(j,0)≤ JL-Ta (2)
where:
Tv = travel time
Ts = holding time
Ta = Lunch time
i: client i j: client j
To validate the robustness of the proposed method, the results obtained are shown below, for which the clients that must be visited in the month of January are used according to the solution found in the previous step, obtaining the daily routes for each of the available vehicles which will be in charge of taking the specialists to the clients to carry out the maintenance. Table 10 shows the design of the route sheet model proposed to carry out the operational maintenance planning, which also includes the vehicle that will carry out the route.
The table shows the routes for 3 working days of a vehicle.
In the event that a client requires a service time greater than the working day (435 minutes, discounting lunch hours), the following day those clients and the time necessary to complete their maintenance are considered.
According to the results of Table 9, client 2 manages to satisfy his maintenance needs with only one visit, while client 3 needs 2 visits and clients 4 and 7 need 3 visits.
Table 10
Roadmap for operational maintenance planning

Note. Own elaboration with the results of the execution of phase IV.
Phase V: Analysis of effectiveness and improvement
The analysis of the effectiveness and improvement of the proposal is directed in three directions: 1) control the results achieved, 2) establish mechanisms to register the real parameters that allow its improvement and 3) perfect other processes of the entity.
The monitoring and measurement of the process control indicators and variables must be monitored and audited to detect nonconformities and to establish corrective and preventive actions with a view to the continuous improvement of the service.
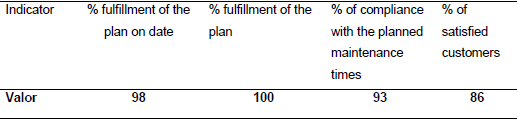
Table 11 shows the set of indicators proposed by the authors, considering the service quality characteristic to which they respond, they are not the only possible ones, each entity may use these or others according to their interests.
Table 11
Proposed indicators and their calculation method

Note. Own elaboration.
Not all the indicators proposed in table 10 were possible to evaluate. However, the calculated indicators show how the use of quantitative tools allows to improve compliance with the maintenance plan. The results are shown in Table 12.
Table 12
Indicators
Note. Own elaboration.
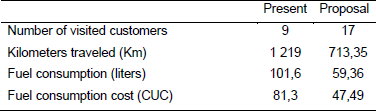
In addition to these indicators, due to their importance, other management indicators are analyzed for the month of January that allow validating the proposal made in the work: number of customers visited, kilometers traveled, fuel consumption and cost per fuel consumption. Table 13 shows the results achieved.
Table 13
Results of the operational planning of maintenance
Note. Own elaboration.
3. Results
The results obtained with the application of the quantitative tools for the selected month showed that the cost of fuel consumption is reduced by 41.5% compared to the current one, the resources used each day were 4 vehicles with 12 specialists. Even when the sample used was only taken with the clients that must be visited in a month, it can be concluded that there are reservations in the planning of the maintenance currently carried out by the entity. The proposal made in this work confirms that with the company's available resources, the preventive maintenance service can be extended to a greater number of clients, reporting more profit and a better use of resources.
CONCLUSIONS
The lack of comprehensiveness in the current planning of the maintenance service in the entity under study causes breaches in the plan, affecting the frequency of maintenance according to the type of system.
The work procedure designed allows the integration of quantitative and qualitative tools to guarantee annual planning with a scientific nature and with a more rational use of resources, promoting a greater focus on the client.
The validation of the improvements proposed in the planning of the service showed that it is possible to carry out an annual planning with a comprehensive approach that raises the efficiency levels of the company.
The proposed procedure can be applied by any entity that provides on-site maintenance services.
REFERENCES
Please refer to articles in Spanish Bibliography.
BIBLIOGRAPHICAL ABSTRACT
Please refer to articles Spanish Biographical abstract.