Simplified representation of the pepper production chain for paprika
Note. Own elaboration based on Maggi (2014)
Application of the failure mode and effects analysis tool in small-scale agroindustrial supply chains
(*)Silvana Elizabet Castillo; (**)Juan Carlos Michalus
(*)Facultad de Ingeniería. Universidad Nacional de Salta
Salta, Provincia de Salta, Argentina
se_castillo@yahoo.com.ar
(**)Facultad de Ingeniería. Universidad Nacional de Misiones
Oberá, Provincia de Misiones, Argentina
michalus@fio.unam.edu.ar
Reception date: 06/19/2022 – Approval date: 07/29/2022
DOI: https://doi.org/10.36995/j.visiondefuturo.2023.27.01.006.en
ABSTRACT
The functioning of Agroindustrial Supply Chains is affected by the different internal and external contexts in which they develop. The objective of this work is to apply the Failure Mode and Effects Analysis method in an agroindustrial production chain in the Northwest of Argentina and identify the potential failures that may appear throughout its operation. Through a descriptive research and a previous background analysis, the instrument was applied in the different links of the production chain and a series of corrective measures were designed. The results obtained demonstrate the need to formulate a comprehensive Management Model for agroindustrial supply networks, which will improve their performance and contribute to the decision making process. The tool used can be adapted and replicated in agroindustrial production chains with similar characteristics.
KEYWORDS: Risk management, FMEA, Agribusiness Supply Chain
INTRODUCTION
The global transformations were introducing abrupt changes at the social, political, economic, environmental and cultural level in the functioning of the Agroindustrial Supply Chains, mainly in those small-scale rural sectors. Faced with these changes, different methodologies have been developed that allow risks to be managed in advance, and to develop preventive plans that mitigate their negative effects.
In this work, the Failure Mode and Effects Analysis (FMEA) tool will be used for the analysis and detection of potential failures that may occur in an Agroindustrial Supply Chain located in the Northwest Region of the Argentine Republic. In the entire productive structure of the province of Salta, agricultural production plays a fundamental role in the primary sector. The Horticultural Chain is one of the most important, especially, the Pepper Production Plant which will be taken as a case study for the application of the FMEA tool. Some authors (Benítez, 2019; Centro Regional Salta-Jujuy, 2011; Halusch Escribas y Belmonte, 2018; Maggi, 2014; Manzanal et al., 2006) have detected the main problems along the aforementioned chain:
In addition to the aspects mentioned, some authors (Halusch Escribas y Belmonte, 2018) have described the socioeconomic context in which productive systems are developed. In the initial stages, it has been observed that in most cases the introduction of technology and innovation to certain processes and products does not present sustainability over time, due to either the weak strengthening of producer organizations, the lack of specificity of projects and/or financing. During the commercialization and distribution stages, a market of oligopolistic type is detected where intermediary buyers exercise domain over the producers. From the economic point of view, differences of cost can be detected between the paprika previously treated with technology and the untreated product, which is reflected in the sale prices and in the product quality in markets and supermarkets. The system described is complex so to solve a specific problem, the context to which they belong cannot be ignored. Specific interventions do not solve systemic problems, therefore it is necessary to:
According to the mentioned above, it is considered necessary and pertinent to carry out an initial diagnosis of the pepper supply chain, evaluate the context in which it develops, and detect potential failures that affect its operation. In this sense, the Analysis of Failure Modes and Effects applied to the aforementioned Supply Chain will allow to detect the causes and potential failures in an integral way, and thereby establish the corrective measures that mitigate the negative effects.
The following specific objectives are established:
Fundament
Risk assessment presents different methodologies and tools that help to generate continuous improvements in processes and, if they are applied systematically and properly, they can detect the different vulnerabilities and weaknesses of a system (González, Myer, y Pachón-Muñoz, 2017; Ostrom y Wilhelmsen, 2019). Failure Mode and Effects Analysis (FMEA) is a methodology that identifies potential failure modes in a system, a product or a manufacturing/assembly operation generated by different process deficiencies. Likewise, it allows the identification of critical design or process characteristics that require special controls to prevent or detect failure modes (Alayo Gómez y Becerra Gonzales, 2013; Ramírez Ramírez, 2021). Other authors define it as one of the most widely used techniques to list the possible ways in which components can fail. Five types of FMEA are identified: system, design, process, service and software (Neira y Velásquez, 2017). It is a very diversified methodology in its application, but it is useful to know for sure the activities that are carried out, the way in which they are carried out, the identification of faults and their effects, and the most effective ways to implement them so that the service /process operation function in a safer way (Astier Peña, Maderuelo Fernández, Jiménez Julvez, Martín Rodríguez, y Palacio Lapuente, 2010).
It is recommended to start FMEA at very early stages of product development such as in design conceptualization; and extend its application throughout the life of the product or service. In the FMEA procedure, failures are prioritized according to the gravity of their consequences, the frequency of occurrence and the mechanisms of detection. It must be taken into account that the FMEA is a document that will require revision at least once a year (Neira y Velásquez, 2017).
The FMEA tool is used in numerous activities, and in different Supply Chains. In some cases, combined maintenance policies are applied in organizations that manage physical assets, for example, the case of a hydroelectric power plant in which methodologies such as FMEA, Criticality Analysis, Life Cycle and Reliability focused maintenance are developed (Martinez Monseco y Planaguma Vilamitjana, 2021).
From the social point of view, it has been applied at hospitals as a risk management and continuous improvement instrument in the provision of services, among which are the Clinical Risk Management Systems (Mateus, 2015).
The applications are also registered in the Logistics Department of Fish Products, where FMEA and diagnostic procedures were applied (Zaila, Jiménez, Casanueva, de la Cruz Rivadeneira, y Yumar, 2021). In addition, its use was revealed is in the fuel industry. It was applied in a fuel station, which had the objective of proposing measures to mitigate the existing risks in the defuelling through the application of risk analysis techniques, monitored with the FMEA tool, where the potential risks were identified, as well as the degree of risk involved in each part of the activity. This tool was also used in activities of a different nature, such as footwear companies, among others (Sánchez Chiriboga y Tello Morales, 2021).
In the agroindustrial sector, the use of this tool has been detected in the production system of virgin olive oil (Perez Catedra, 2019), and also to identify and prevent the risks of the commercialization process of vitroplants of sugarcane (Freire, Osés, Aguila, Esquirol, y Villegas, 2014). Besides FMEA was also applied on another reference study to validate a Prospective Human Error Analysis Methodology developed for biofuel plants (Calvo Olivares, 2016).
Agrifood Supply Chains are complex and susceptible to different vulnerabilities and risks. In these situations, various risks have been analyzed using a multi-method approach, including a thematic analysis, a full interpretive structural modeling, and a matrix multiplication analysis of difuse cross impact applied to the classification study (Zhao et al., 2020). In other works related to Agroindustrial Chains, the application of Slender Manufacturing tools was found for the mitigation of operational risks in Agroindustrial Supply Chains of avocado, such as the mapping of the Value Chain, the FMEA and the Deployment of Quality Function and Diffuse Logic. However, it was detected that disruptive events are not evaluated and can influence the normal functioning of the supply chain (Paredes-Rodriguez, Chud-Pantoja, y Peña-Montoya, 2022).
In the Northwest Region of the Argentine Republic the provinces of Salta, Jujuy, Tucumán, Catamarca and Santiago del Estero are located. Of all of them, the province of Salta has the largest number and diversity of Agroindustrial Chains (Castillo, Michalus, Solá Alsina, y Arciénaga, 2021). As it was mentioned above, one of the most relevant Chains is the Horticultural Chain, and among them the Pepper Production Plant. The production of pepper for paprika is an important economic activity in the Calchaquíes Valleys in the Northwest of Argentina (in the provinces of Salta, Tucumán and Catamarca). It was taken as a study for the application of the FMEA tool.
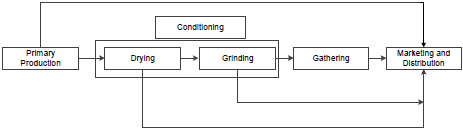
Pepper is one of the characteristic commercial crops of the region; its production represents more than two thirds of the whole national production, positioning the region as the main producer (Cieza, 2010; Maggi, 2014). The agroindustrial chain of the mentioned product is made up of a series of stages, shown in Figure N°1:
Figure N°1
Simplified representation of the pepper production chain for paprika
Note. Own elaboration based on Maggi (2014)
The primary production system for paprika peppers consists of the planting and harvesting stages, and includes around 1200 small producers in their great majority with informal, undercapitalized and disorganized jobs (Halusch Escribas y Belmonte, 2018; Maggi, 2014). Farms range less than 5 hectares, and land lease and sharecropping1 systems predominate (generally, a percentage between 25-50% of the gross harvest is handed over or paid). This sector is characterized by a subsistence economy and an informal technical management of the crop by family labor. The two types of peppers used in the cultivation areas are the round-shaped ones or “salteño small ball” and the long ones or “elephant trunk”. The pepper that is the most used is the latter, since there is more seed availability and yield. Regarding the harvest calendar, the fruits are manually harvested between February and April, as they reach fruit maturity (an intense red color). The average productivity of the crop is approximately 1200 kilograms per hectare. In relation to the product obtained, the fruits are classified as "first class" or peppers that have an intense red color without spots; "second class" or the stained, discolored and with scalds ones; and “third class” those that are completely stained (Maggi, 2014).
In Figure N°1, the conditioning stage includes two stages: drying and grinding. In the drying stage, the pepper pods reach between 9 and 12% humidity, and have a flexible consistency to prevent deterioration until they are ground. The drying process of the pepper can be carried out by different methods, the most economical and used one consists of direct exposure to the sun on the ground, however this method exposes subjects the product to contamination and threatens its quality. Another alternative technology is recommended by the National Institute of Agricultural Technology (INTA) through the use of shopkeepers. This type of structure achieves between 90 and 95% of the first quality material, free of soil and impurities (Maggi, 2014). Other technological procedures for controlled drying is through solar energy or industrial ovens (with the contribution of fuel energy or through mixed systems). Generally, the first system is made up of a 500 m2 stone solar collector and a drying tunnel with a capacity of 30 carts of 100 kg of fresh pepper that operate with auxiliary energy and produce around 500 kg of dry pepper per day (Condori, Echazú, Durán, y Saravia, 2008). The limitation of this type of technology is the capacity of the oven.
The grinding phase begins by adding the pepper peel to a grinder to the degree of "impalpable". There are many technologies to carry out this process, the most used one is performed out in handcrafted stone mills. However, the disadvantage of the latter is the decrease in color and flavor of the end product quality. Particularly, stone mills reach high temperatures, which produces evaporation of part of the oil contained in the pepper, and negatively impacts on the intensity of the original color. The red coloration of the paprika and its oleoresin represent one of the main quality requirements and it is expressed by the total content of carotenoids present in the pepper (ASTA degrees). Stone mills are inefficient since they cause a reduction of almost 50 ASTA degrees. In order to the paprika pepper meet the conditions for its commercialization in the international market, it must reach at least 120 ASTA degrees (Maggi, 2014). Industrial mills have the capacity to grind about 500 kg of paprika per hour, unlike stone mills that produce about 500 kg per day. At the time of the survey, there are 7 mills of this type operating in the province of Salta, 4 of which are located in San Carlos, 2 in Cachi and 1 in Cafayate. While in the province of Catamarca there are 9 mills located in the Department of Santa María. The product obtained is internationally known as "peppers" or "paprika". Producers generally sell unground, dried fruits. The grinding, in most cases, is in charge of collectors, spice companies and distributors, who sell the product in bulk, or in fractions. The spice companies usually have their own production and grinding service, or they usually buy the production of third parties, divide it up and pack it. The industry requires about 70% of paprika production. The main demand is the meat sector, which used it as flavorings, preservatives and dyes. It is also used for the production of plant extracts such as oleoresin, in the pharmaceutical, cosmetic, and health-care industries. The remaining 30% of paprika production is destined for the retail channel (supermarkets, warehouses, among others) for direct fractional consumption (Maggi, 2014).
Regarding marketing and distribution, the incipient organization of producers, the low scale of production and the product quality, are key factors that negatively influence the final price paid to the producer. Associativism increases production volumes, and the bargaining power of producers against millers and collectors, thus facilitating the purchase of equipment for shared use and increasing the value of dry peppers on the branch (Secretaria de Asuntos Agrarios-Gobierno de la provincia de Salta, 2016).
DEVELOPMENT
Materials and methods
The suggested procedure for the application of the FMEA tool applied to a Supply Chain is summarized in Figure N°2 (Bestratén Belloví y Orriols Ramos, 2004; García Cánovas, 2015):
Figure N°2
Procedure for the application of FMEA
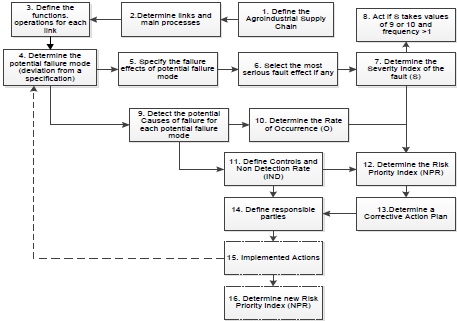
Note. Own elaboration based on García Cánovas (2015)
Steps 1, 2 and 3: Define the Agroindustrial Supply Chain, links and main processes of each link
First, the Agroindustrial Supply Chain, the links and main processes, functions and operations for each link must be defined.
Step 4: Determine the potential failure mode (deviation from a specification)
This concept implies that an element or system does not work or does not meet the specifications determined within a Supply Chain.
Steps 5 and 6: Specify failure effects of the potential failure mode. Select most severe failure effect if any
Assuming that the failure has occurred, the effects are described as the client would do (internal client is considered the one that participates directly in the chain, and external client is the one that affects or is affected in some way by the chain, for example the final consumer, supplier, etc.). When a part or component is analyzed, the effect on the system will be also taken into account. If a failure mode has many effects, the most severe is generally chosen when evaluating.
Steps 7 and 8: Determine the Failure Severity Index(S). Act if S takes values of 9 or 10
It is related to failure mode effects, and the level of consequences perceived by the customer is estimated. It is based on the effects of the failure. The severity index is independent of the frequency and detection. To use common criteria, a classification table of the severity of each failure effect was used (Table N° 1).
Table N°1
Classification of the severity of each failure effect
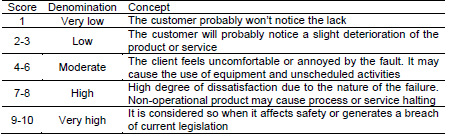
Note. From Bestratén Belloví y Orriols Ramos (2004) y Torres Rusindo (2015)
If the severity index takes values of 9 or 10, and the frequency and detection are greater than 1, the fault and its corresponding characteristics are considered critical.
Step 9: Detect Potential Failure Causes for each potential failure mode
For each failure mode, its potential causes are determined. The related causes were expressed concisely and completely, so that preventive and corrective actions can be stated directly.
Step 10: Determine the Rate of Occurrence (O)
It indicates the probability that a specific cause will occur and generate the failure mode. It is a value determined by knowledge and experience of the supply chain, although it can also be established from historical information.
It is related to the cause of the failure, and it is determined by establishing the probability of occurrence on a scale from 1 to 10, according to what is shown in Table N° 2:
Table N° 2
Classification of the occurrence of the cause
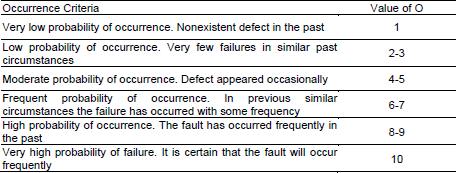
Note. Torres Rusindo (2015)
Step 11: Define Controls and Rate of No Detection (IND)
Existing controls to detect the failure or its resulting effect are described. The "non-detection" will increase to the extent that the control system is not reliable to detect the failure or its cause, according to the scale presented in Table N° 3:
Table N° 3
Classification of the non-detection of the cause
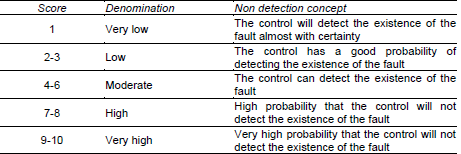
Note. From Bestratén Belloví y Orriols Ramos (2004) y Torres Rusindo (2015)
Step 12: Determine the Risk Priority Index (RPI)
For each of the potential causes of failure, the Risk Priority Number (RPN) was determined. It was calculated as the product of the probability of occurrence (O), the severity (S), and the probability (D) of non-detection. The RPN is used for the purpose of prioritizing potential causes of failure for possible corrective action. The RPN is also called RPI (Risk Priority Index) and is calculated as: RPI = S x O x D.
They are evaluated on a scale of 1 to 10, the RPN has a scale of 1 to 1000. This allows to set threshold values, for which it is considered necessary to define corrective actions (adopting as a criterion to define actions if the RPN exceeds 200 points or if the severity is 9 or 10).
Steps 13 and 14: Determine a Corrective Action Plan and define those responsable
A brief description of the recommended corrective actions is made. A certain order of priority must be followed. Those responsible for the different proposed actions and the expected dates of their implementation are indicated.
Steps 15 and 16: Actions Implemented, and determine the new Risk Priority Index (RPI)
The implementation of the proposed actions allows for a permanent evaluation of the measures, and the determination of New Risk Priority Index to verify the effectiveness of the measures.
Results and discussion
The FMEA procedure was applied to each of the links of the Agroindustrial Supply Chain of pepper, but for space reasons, only the use of the tool in the primary production stage is described, following the steps indicated in Figure N°2.
Steps 1, 2 and 3 in Figure N°2: In the analyzed case, the functionality of the links of the Supply Chain has been submitted and previously described. The main links identified are:
b. Subsequently, the potential failure mode (deviation from a specification) corresponding to the operation of the processes of the links of the analyzed chain was determined (Step 4 of Figure N°2). As an example, its application to the first stage of primary production corresponding to the sowing and harvesting of paprika is shown, as shown in Table N°4:
Table N°4
Potential failure modes of the primary production stage
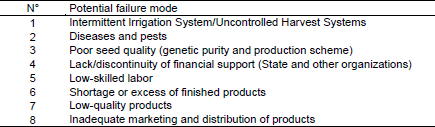
Note. Own elaboration
c. Next, the effects of the failure corresponding to each potential failure mode were specified (Step 5 in Figure N°2). In the case of the primary production link, the effects of failure were analyzed for each failure mode as presented in Table N° 5:
Table N°5
Effect/s of the failure for each potential failure mode of the primary production stage
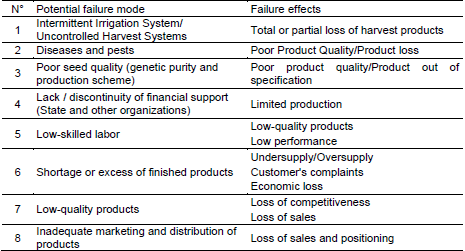
Note. Own elaboration
d. Select the most serious fault effect, if any (Step 6 in Figure N°2). In the case considered, all effects were analyzed.
e. Determine Failure Severity Index (S) (Step 7 of Figure N°2)
In the case of primary production, the Failure Severity Index was determined for each effect of it, as it is shown in Table N° 6.
The weighings were made according to the current behavior of the Chain. The indices that each member of the research team individually established, based on their knowledge and experience, were averaged.
Table N°6
Severity of the failure of each failure effect
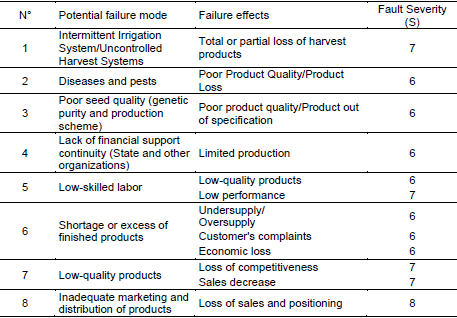
Note. Own elaboration
It is observed that according to the values obtained, the effects of failures are not considered critical.
f. Determine the potential Causes of failure for each potential failure mode (Step 9 in Figure N°2). In the case of the primary production link, the potential causes of failure were identified, as shown in Table N° 7:
Table N° 7
Potential causes of failures defined from potential failure modes
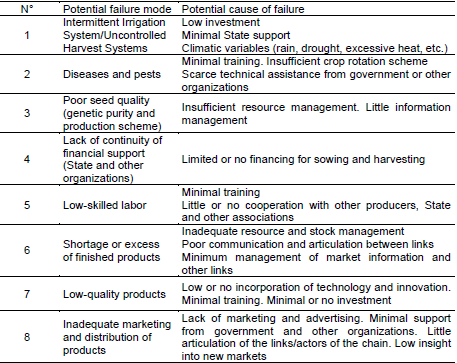
Note. Own elaboration
g. Determine the Occurrence Rate (O) (Step 10 in Figure N°2)
A procedure based on the experience and knowledge of the research team was used, the results of the established index by each member were averaged. The rate of occurrence was determined for each Primary Production Failure Cause, as can be seen in Table N° 8:
Table N°8
Occurrence Rate Determination
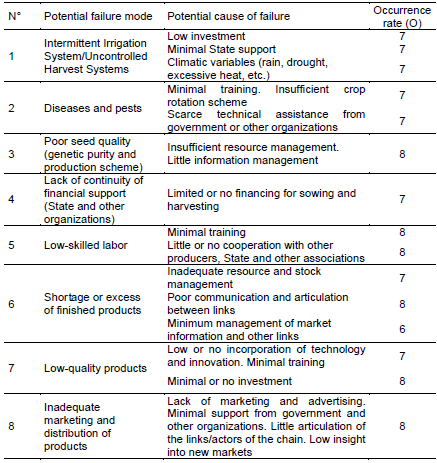
Note. Own elaboration
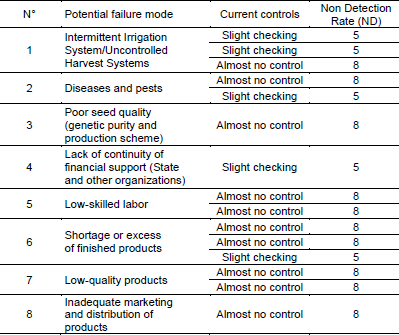
h. Define controls and Non-detection Index (Step 11 in Figure N° 2)
In the primary production system, the controls and non-detection index were determined as shown in Table N° 9:
Table N° 9
Rate of Non Detection of Causes
Note. Own elaboration
i. Determine the Risk Priority Index (RPI) (Step 12 in Figure N° 2)
For the case of the link under analysis, the RPI was determined, and ranked from highest to lowest, as can be seen in Table N° 10:
Table N°10
Risk Priority Number for Causes of Failure
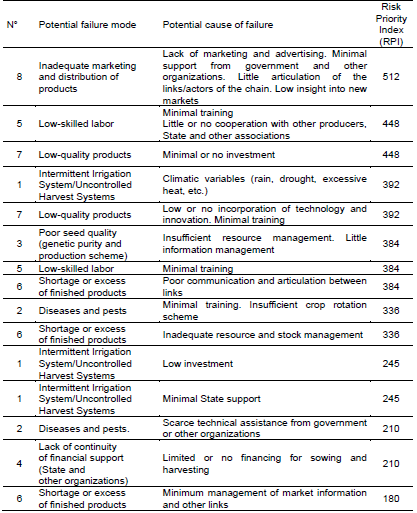
Note. Own elaboration
In this link, it can be seen that most of the RPI associated with each of the potential causes of failure are greater than 200. In order to design a corrective action plan, the RPIs were ranked from the highest to lowest order of importance, and for each of them a series of corrective measures were formulated.
In the same way, the procedure explained for the other links in the chain was applied. According to the results obtained, a total of 27 RPI were determined, 14 in the primary production stage (sowing and harvesting), 7 in the drying stage, 4 in the grinding stage and 2 in the Marketing and Distribution stage.
i. Prepare the corrective action plan and define those responsible
In the analyzed case, the corrective measures and those responsible for each of the calculated RPIs are proposed. In the analyzed case, the corrective measures and those responsible for each of the calculated RPIs are proposed. A total of 27 measurements were obtained for each RPI. In some cases, the corrective measures correspond to more than one link, and affect the entire chain as a whole. Due to the length of the final table obtained, Table N° 11 presents an example corresponding to the maximum RPI value obtained in the Primary Production stage:
Table N° 11
Corrective Measures for the maximum value of RPI
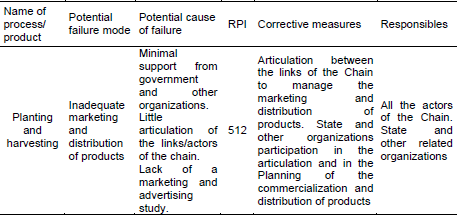
Note. Own elaboration
Once the proposed corrective measures were implemented, it would be convenient to determine new RPIs, which evaluate whether the actions carried out were adequate or not. After applying the FMEA to all the links of the Supply Chain, as well as the potential failure modes, causes and the respective corrective measures proposed on the maximum RPI values obtained, the main points resulting from the analysis are synthesized in order of importance:
Based on the RPI obtained in each of the links of the Supply Chain, a series of measures and corrective actions are detected that involve all the actors present in the territory, the State, Academia, Companies and local associations. This highlights the lack of an Integral Management Model for small scale rural sectors, which involves all direct and indirect actors, and allows performance improvement, strengthening the Supply Chain, preserving local identity, and contributing to sustainable local development through such practices.
CONCLUSIONS
NOTES
1.Sharecropping: is a contract in which the owner of an agricultural or livestock land grants its exploitation as a loan to a third party in exchange for money, or the benefits of the harvest or another agreed payment method
REFERENCES
Please refer to articles in Spanish Bibliography.
BIBLIOGRAPHICAL ABSTRACT
Please refer to articles Spanish Biographical abstract.